


 Price Prediction: Will This Falling Wedge Pattern Trigger the Next Rally")


TLDR
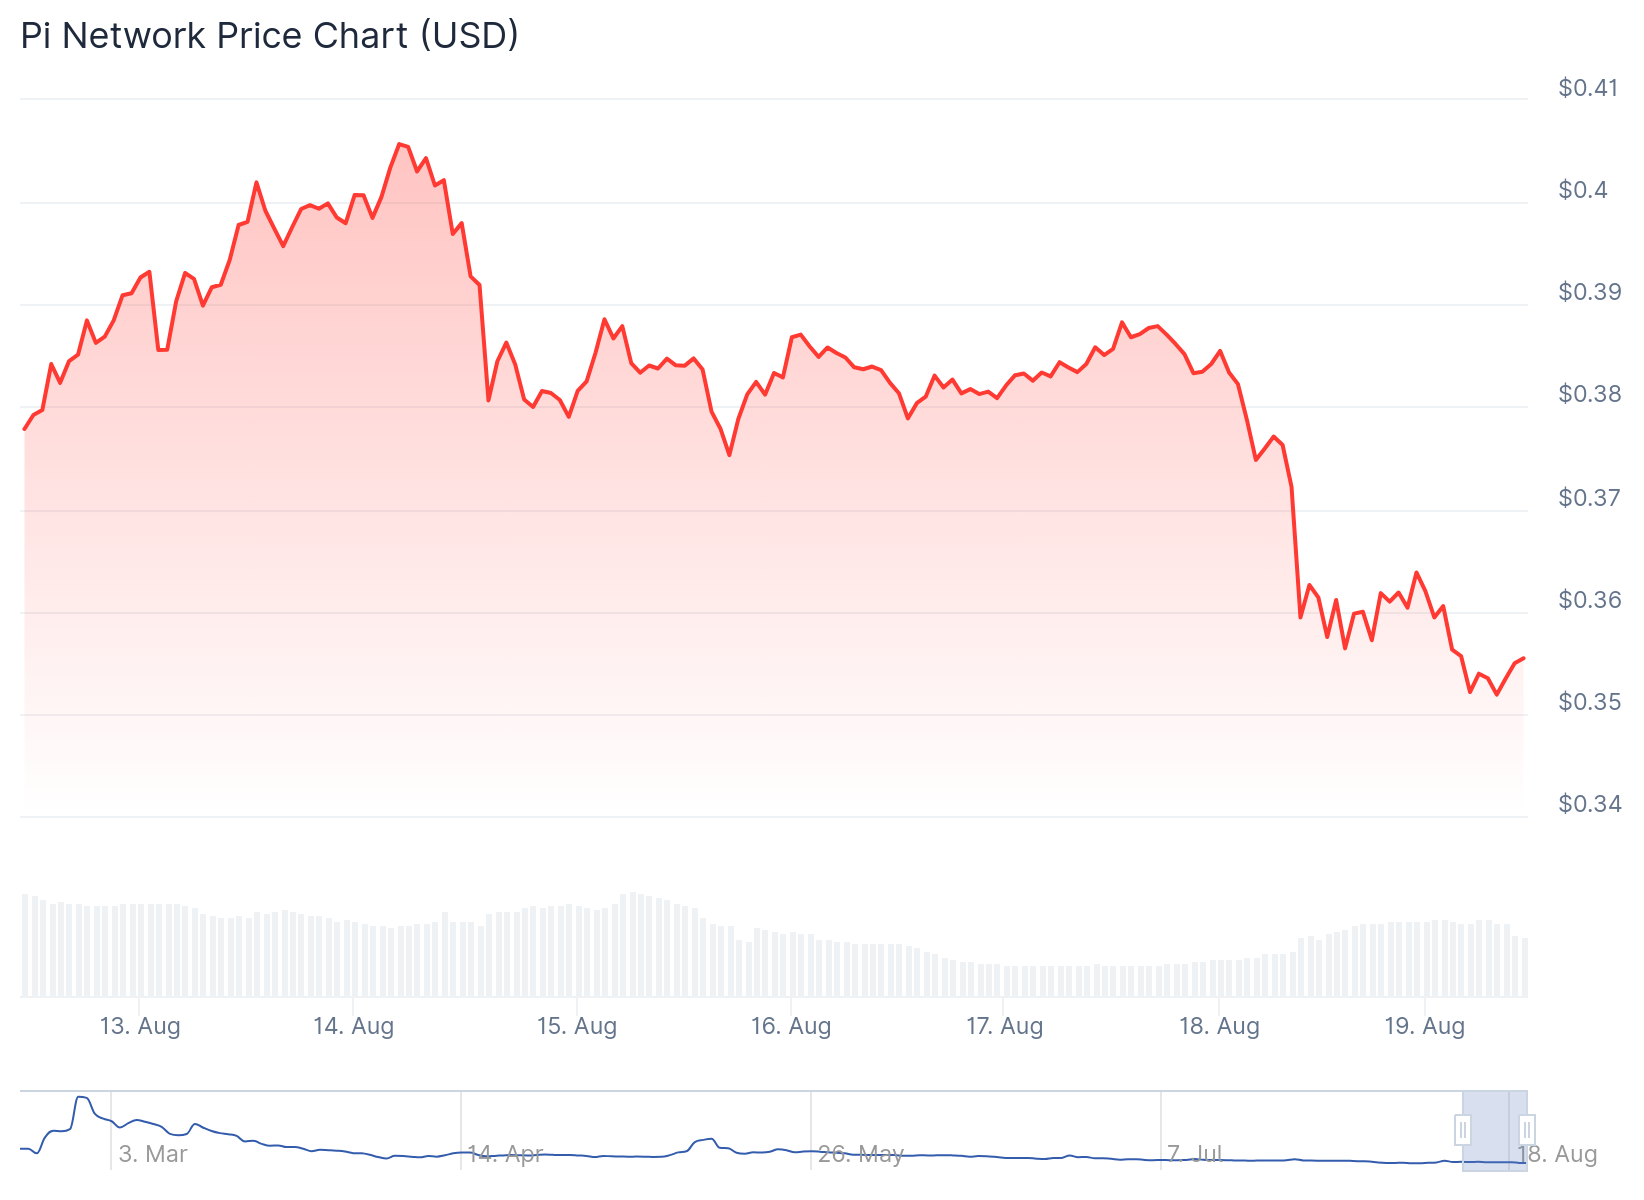
- Pi Coin dropped 7.4% to $0.354, breaking through key $0.362 support level
- RSI and MACD indicators show growing bearish momentum with potential for further decline
- Token approaches historic low of $0.322, representing potential 8.9% drop from current levels
- Technical analysis reveals falling wedge pattern that could signal bullish breakout
- Major exchange listings and token burns identified as key catalysts for price recovery
Pi Coin continues to face downward pressure as the cryptocurrency trades near historic lows. The token has dropped 7.4% in the last 24 hours to $0.354.
The decline pushed Pi Coin below the critical $0.362 support level. This breakdown raises concerns about the token’s ability to find stable footing in current market conditions.
Technical indicators paint a bearish picture for the short term. The Relative Strength Index has experienced a sharp decline, showing growing bearish momentum.
The RSI has not yet reached the oversold threshold of 30.0. This suggests that a reversal may not be imminent despite the recent price drops.
Pi Coin’s Moving Average Convergence Divergence indicator is approaching a bearish crossover. The signal line is moving closer to crossing over the MACD line.
This potential crossover would mark a shift in momentum. It could reinforce the possibility of further downside movement for the token.
The cryptocurrency currently holds above local support at $0.344. If this level fails to hold, Pi Coin could test its all-time low of $0.322.

A drop to the historic low would represent an 8.9% decline from current prices. This move would further confirm the bearish trend that has dominated recent trading.
Technical Patterns Point to Potential Reversal
Despite the bearish indicators, some technical analysis suggests a different outlook. Pi Coin has formed a falling wedge pattern on longer timeframes.

This pattern consists of two descending and converging trendlines. Falling wedges often precede bullish breakouts when the trendlines near convergence.
The token has crashed from a high of $2.9935 in February to current levels. It attempted a recovery in May, reaching $1.6640 before resuming its decline.
The May rally occurred after developers announced a $100 million Pi Network Ventures investment fund. This fund aims to support startups building on the platform.
Pi Coin remains below all major moving averages. This positioning indicates that bears maintain control of the market sentiment.
PI Network Price Prediction
Several potential catalysts could influence Pi Coin’s future price action. The most impactful would be listings on major exchanges like Binance, Upbit, or Coinbase.
Question Asked: What do you think of August 15? Will Binance list Pi?
My Answer: I have addressed this question before. I do not think Binance is ready to list Pi in August, and I also do not believe the Pi Core Team is ready to be fully transparent about its Open Mainnet…
— Dr Altcoin (@Dr_Picoin) August 10, 2025
Such listings would provide access to millions of global investors. Historically, cryptocurrencies have surged significantly following major exchange listings.
Token burn announcements represent another potential catalyst. Last week, OKB price surged after OKX announced plans to burn tokens worth billions.
Pi Network has launched several initiatives that have had limited price impact. These include Pi AI Studio and the Pi Ventures fund announcement.
The cryptocurrency has also largely ignored the broader market rally. Bitcoin and most altcoins have posted gains while Pi Coin continued declining.
A successful bounce from the $0.344 support could invalidate the bearish thesis. Recovery above $0.362 might trigger a breakout toward $0.401.
The falling wedge pattern suggests potential upside targets at $1.0000 or even $1.6640. These levels would represent gains of 165% and 328% respectively from current prices.
Pi Coin currently trades at $0.354 as markets assess whether the token can find support above historic lows.


