


 Price Prediction: Could This Dip Be The Perfect Buying Opportunity?")
TLDR
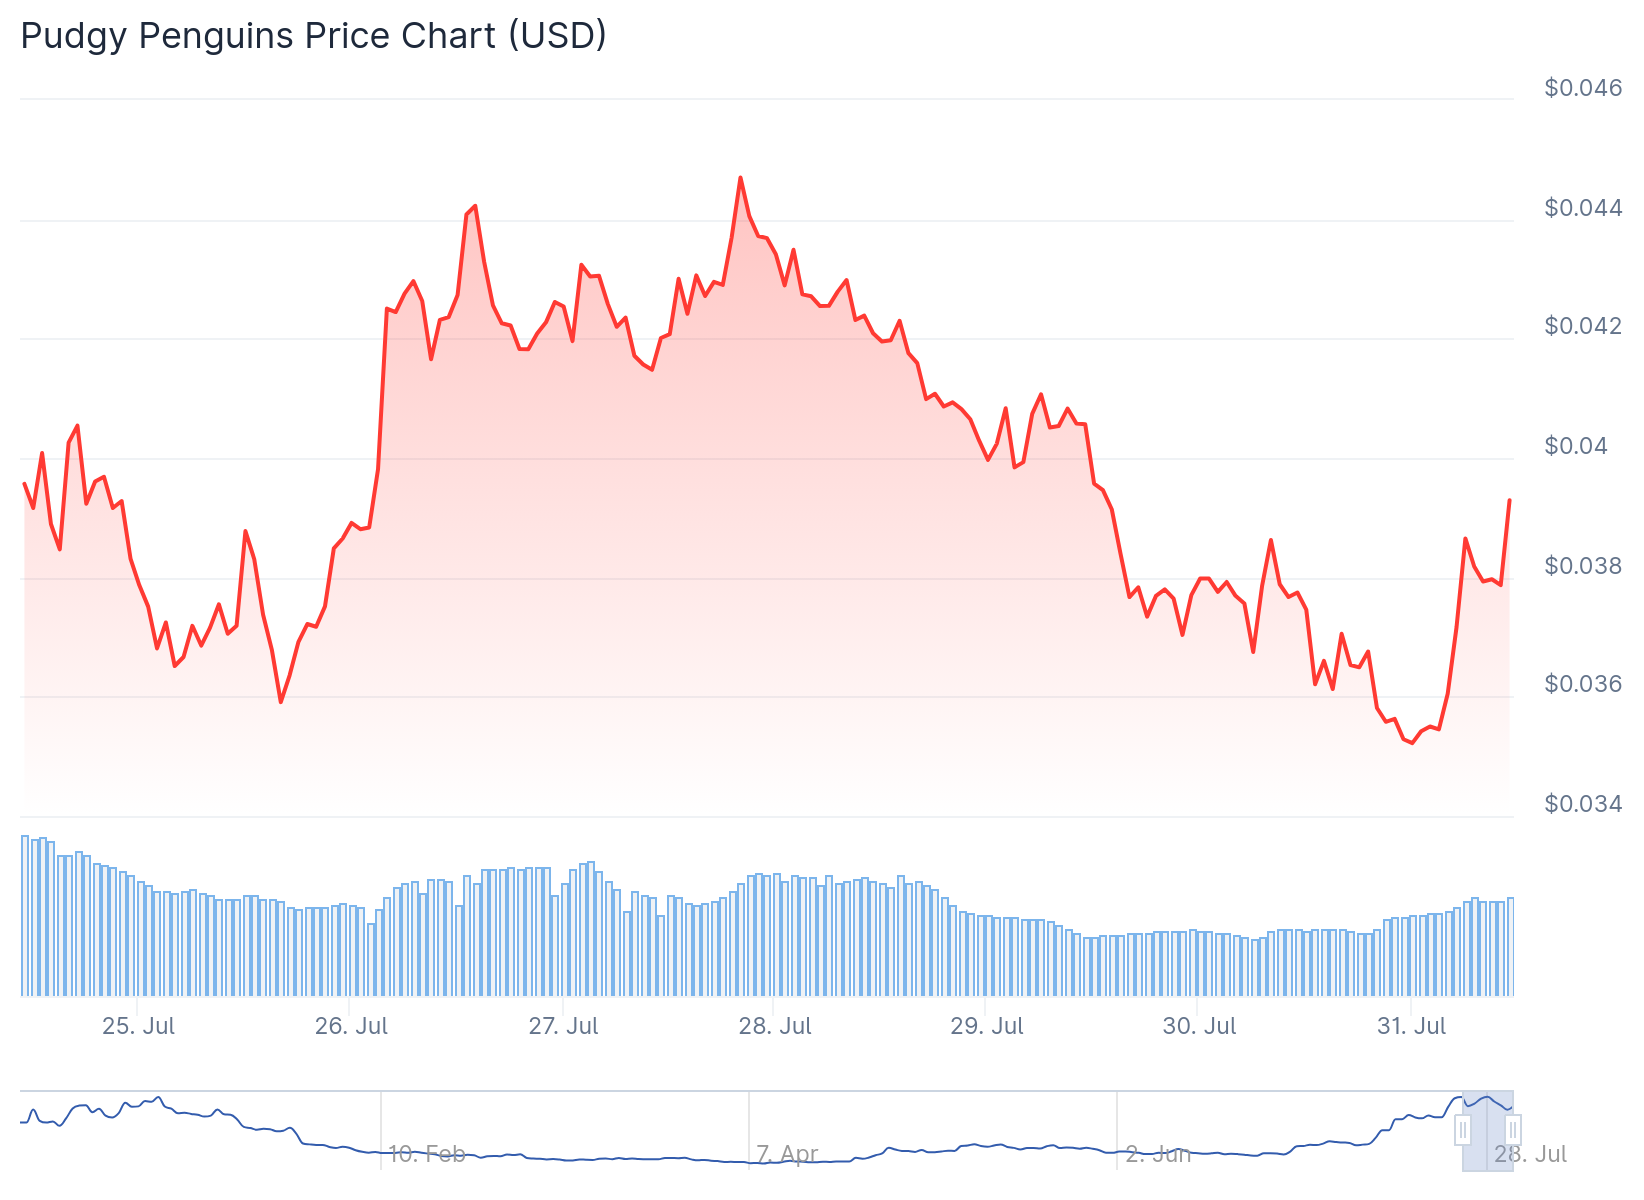
- Pudgy Penguins (PENGU) trades at $0.03797, down 6.11% in 24 hours
- TD Sequential indicator flashed a buy signal suggesting potential reversal
- RSI shows bullish divergence with price making lower lows while RSI makes higher lows
- Token consolidating in parallel channel near support level around $0.037
- Multiple analysts point to potential breakout targets of $0.07-$0.10
Pudgy Penguins (PENGU) price currently trades at $0.03797, reflecting a 6.11% decline over the past 24 hours. Despite this recent downturn, technical analysts are identifying several bullish signals that could indicate a potential price reversal.
The Tom Demark Sequential indicator has generated a buy signal for PENGU on the hourly chart. This technical tool tracks price movements through two phases: setup and countdown. The setup phase counts nine consecutive candles of the same color, with the ninth candle typically marking a potential top or bottom.
$PENGU looks ready to rebound, with multiple bullish signals aligning:
– TD Sequential flashes a buy signal
– Setup trendline holding as support
– Bullish divergence on the RSI
– Trading at the channel’s lower boundaryAll signs point to liftoff! pic.twitter.com/zxBRQRANak
— Ali (@ali_charts) July 30, 2025
PENGU recently completed this setup phase with nine red candles. This pattern suggests the cryptocurrency may be approaching or has reached a local bottom.
RSI Divergence Points to Weakening Selling Pressure
The Relative Strength Index for PENGU shows bullish divergence against the price action. While the token continues to make lower lows, the RSI has been printing higher lows. This divergence typically signals that selling pressure is diminishing.
The RSI previously dropped below the 30 level, indicating oversold conditions. The indicator has since climbed back above this threshold while the price continued declining. Technical analysts often view this pattern as a precursor to upward price movement.
PENGU is currently trading near the lower boundary of a parallel channel formation. This pattern forms when an asset consolidates between two parallel trendlines that run horizontally.

Pudgy Penguins Price Prediction
The lower line of the parallel channel typically acts as support, while the upper line serves as resistance. PENGU’s proximity to this support level around $0.037 could provide a foundation for price stabilization.
Several analysts have identified potential price targets for PENGU ranging from $0.07 to $0.10. These projections are based on various chart patterns including cup-and-handle formations and ascending triangle structures.
Is $PENGU the $DOGE of this cycle?
Since April bottom, $PENGU has pulled a clean 10x and still showing incredible strength.
For those who don't know, $PENGU is the native token of @pudgypenguins, which is a popular NFT project.
In Q4 2024, $PENGU airdropped nearly $1.5B to… pic.twitter.com/WftbiMaldy
— Niels (@Web3Niels) July 29, 2025
The cup-and-handle pattern spans from April’s bottom, where PENGU began a previous rally. The formation’s neckline sits near the $0.045 level. A confirmed breakout above this resistance could trigger the next upward movement.
Market participants are monitoring the $0.044 to $0.045 zone as a critical resistance area. A decisive move above this level could spark increased buying interest and potentially drive prices toward the projected targets.
The symmetrical triangle formation near PENGU’s previous all-time high shows the token printing higher lows while testing horizontal resistance. This tightening pattern often precedes periods of increased volatility.
Daily $PENGU report #94
Pengu is coiling up before the next huge move. The consolidation will likely be over in the next few days. A clear daily break above the previous ATH will spark the rally to 0.07🐧🧊🧪 pic.twitter.com/nhMnHsLXJn— Richie🐧 (@ricsitarjan) July 28, 2025
Technical momentum appears to be aligning with these chart structures. The upward-sloping trendline within the consolidation pattern suggests buyers are gradually establishing control.
Community sentiment around PENGU has grown more optimistic despite the recent price decline. Some crypto influencers have advocated for buying during the current dip, viewing it as an opportunity.
The meme coin sector has shown renewed interest in PENGU. Comparisons to other successful meme tokens have emerged, with some analysts positioning PENGU as a potential standout performer in the current market cycle.
Price action continues to hold above the key trendline near $0.037. This level has provided support during previous corrections and remains a critical technical marker for bulls to defend.
The TD Sequential buy signal represents the most recent technical development for PENGU. This indicator has historically provided reliable reversal signals when combined with other technical factors.
PENGU’s current consolidation phase appears to be entering its final stages based on the tightening price range and decreasing volume patterns observed in recent trading sessions.


