


 Price Prediction: Why This 13% Rally Could Be Just the Beginning")
TLDR
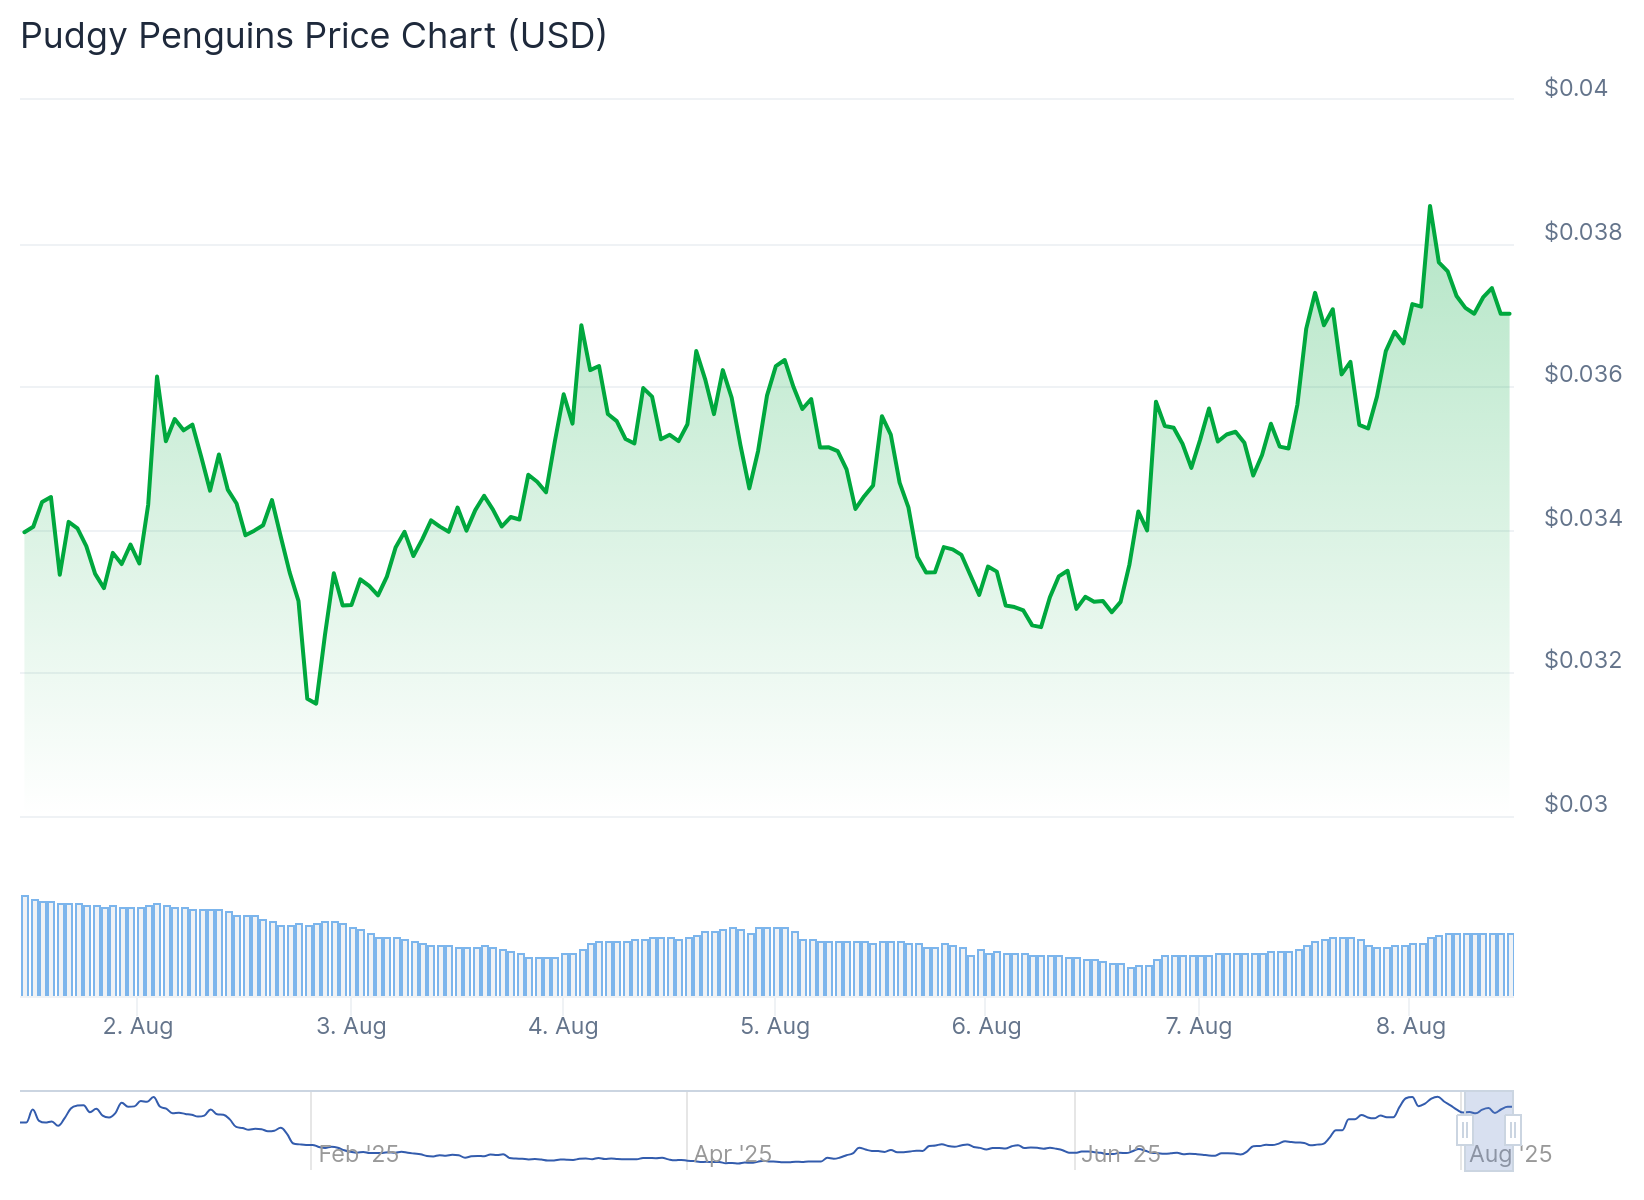
- PENGU surged 13% in 24 hours to $0.0372, outperforming Bitcoin and Ethereum
- The memecoin broke out of a falling wedge pattern with $2.10 million in exchange outflows
- Technical analysis shows bullish momentum with price reclaiming the 50 SMA on 4-hour charts
- Google search interest for PENGU has overtaken SHIBA despite smaller market cap
- Target price of $0.041-$0.046 represents potential 25% upside from current levels
Pudgy Penguins has emerged as one of the top performers in the cryptocurrency market with a 13% surge over the past 24 hours. The memecoin reached $0.0372 at press time, demonstrating strong momentum while outpacing major cryptocurrencies including Bitcoin and Ethereum.
Trading volume for PENGU jumped 60% during the same period according to CoinMarketCap data. This increased activity reflects growing investor participation as the token breaks through key technical resistance levels.
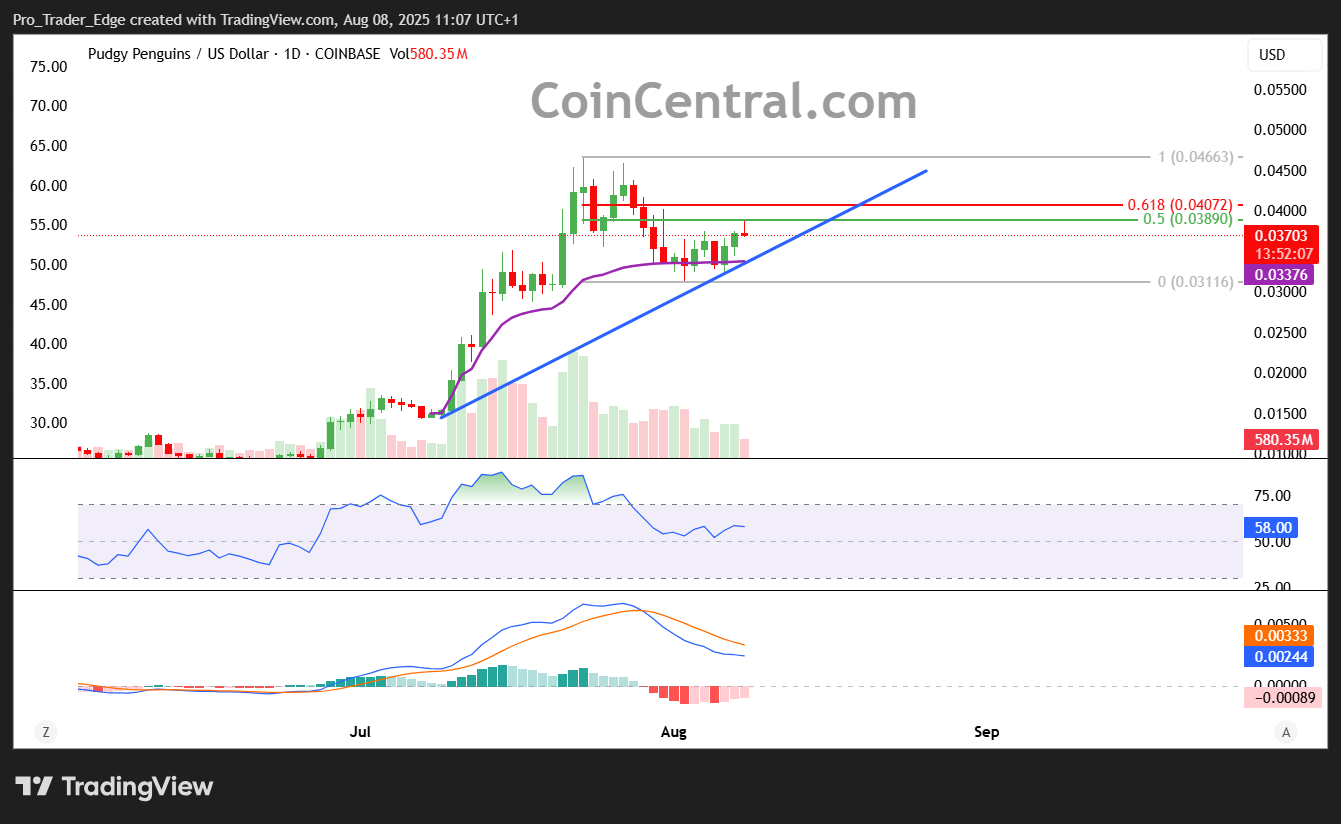
The price surge coincides with PENGU breaking out of a descending channel pattern that had contained price action since late July. Crypto analysts have identified this breakout as a bullish signal with potential targets around $0.041.
$PENGU targets $0.041 after breaking out of a descending channel! pic.twitter.com/3XoUOFkkEr
— Ali (@ali_charts) August 6, 2025
Exchange data from CoinGlass shows $2.10 million worth of PENGU tokens flowed out of exchanges over the past 24 hours. These outflows typically indicate investors withdrawing tokens for longer-term holding rather than active trading.
The withdrawal pattern creates buying pressure as fewer tokens remain available for immediate sale on exchanges. This dynamic often supports upward price momentum in cryptocurrency markets.
Technical Analysis Points to Continued Strength
Pudgy Penguins price recently reclaimed the 50-period Simple Moving Average on the 4-hour chart for the first time since late July. This technical milestone often signals the beginning of short-term trend reversals in cryptocurrency trading.

The breakout occurred with increased trading volume, suggesting genuine buying interest rather than low-volume manipulation. Technical analysts view volume confirmation as essential for validating breakout patterns.
The falling wedge formation that PENGU broke out of represents a classic bullish reversal pattern. These wedge structures typically indicate trend changes when price breaks above the upper resistance line with volume.
Current technical indicators including the Supertrend remain bullish with the indicator positioned below the current price. This configuration suggests the uptrend remains intact and bulls maintain control of price direction.
Market Interest and Positioning Data
Google search data reveals PENGU has overtaken Shiba Inu in global web search interest over the past 30 days. This shift occurs despite Shiba Inu maintaining a much larger market capitalization of $7.2 billion compared to PENGU’s $2.2 billion.
$PENGU flipping $SHIBA on Google Trends? 👀🐧
Over the past 30 days, Pengu went head to head with Shiba on Google Trends and now it’s even higher.
📊 Shiba market cap: $7.2B
📊 Pengu market cap: $2.2BMemes are all about attention.
I'm seeing a huge opportunity here 🐧 pic.twitter.com/eOBFdbSgXW— Scott (@0xScott30) August 6, 2025
Rising search interest often correlates with increased retail investor attention and potential buying pressure. The Google Trends data suggests growing public awareness of PENGU beyond dedicated cryptocurrency communities.
Liquidation mapping data shows traders have built $7.67 million in long positions compared to $3.18 million in short positions. This positioning indicates bullish sentiment among leveraged traders.
Key liquidation levels sit at $0.03465 and $0.0379, though current positioning suggests these levels should not pose major obstacles to upward movement. The predominance of long positions reflects trader confidence in continued price appreciation.
Open interest remains stable without signs of excessive leverage buildup. This positioning creates favorable conditions for organic price movements rather than leverage-driven volatility.
Fibonacci extension levels align with historical resistance zones around $0.0387 and $0.041. These technical levels provide clear targets for the current upward momentum.
The $0.041 target represents approximately 10% upside from current levels, while some analysts see potential for moves toward $0.046 if momentum continues. A sustained break above $0.037 could confirm the next leg higher toward these resistance zones.


