


TLDR
- XRP is trading around $1.40–$1.41, consolidating between $1.35 support and $1.50 resistance.
- XRP investment products have seen $13.74 million in daily inflows, with cumulative net inflows reaching $1.27 billion.
- Volatility has collapsed to a multi-year low of 0.42, a level that historically precedes sharp moves.
- XRP is still below its 50, 100, and 200-day moving averages, all trending lower.
- Analyst Ali Charts flagged a symmetrical triangle pattern pointing to a potential 35% move.
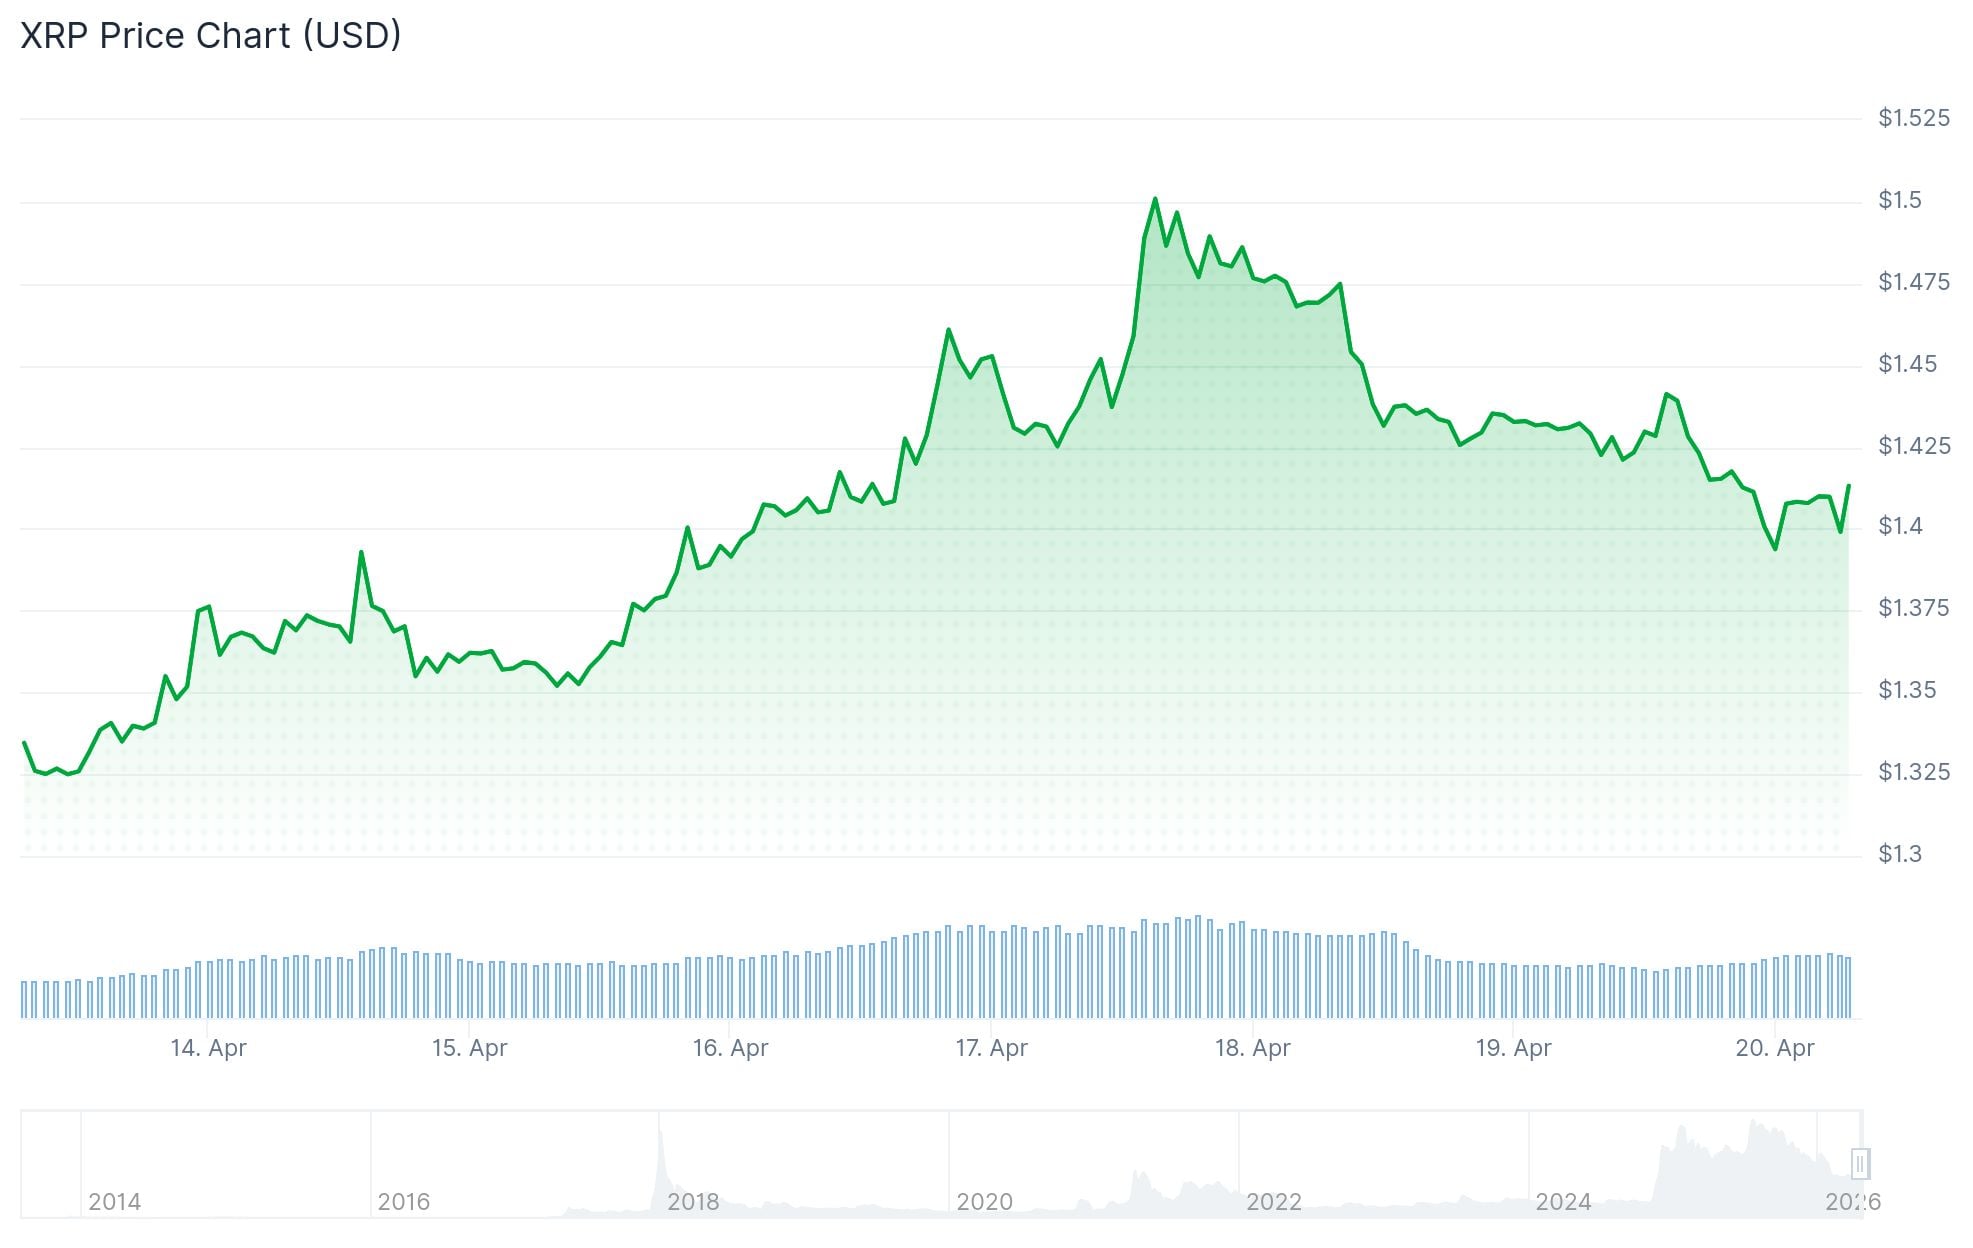
XRP has been trading around $1.40–$1.41, stuck in a tight range that has frustrated both bulls and bears. The token has gained roughly 8% over the past seven days, helped by broader market optimism. Still, it has not been able to break above the key $1.50 level.
The $1.50 zone has acted as a ceiling repeatedly in recent weeks. Traders who bought at lower prices appear to be selling into strength around that level, which creates overhead pressure and slows any upward move.
On the macro side, investors are watching the Federal Reserve’s April 28 policy meeting closely. Any signals on interest rates could shift sentiment across crypto markets, including XRP.
Meanwhile, Bitcoin climbed above $77,000 and Ethereum cleared $2,300, drawing fresh buying across the broader market. Tokens like Solana, Cardano, and Dogecoin also posted moderate gains in the same period.
Inflows Remain Steady
XRP investment products continue to attract capital. Daily inflows came in at $13.74 million, pushing cumulative net inflows to $1.27 billion. That figure points to ongoing institutional interest in the asset.
U.S. spot Bitcoin ETFs added $664 million in a single session, marking four straight days of positive flows. Spot Ethereum ETFs brought in $127 million, extending their own seven-day inflow streak.
Last week Bitcoin spot ETFs logged $996M inflow, extending streak to 3 weeks
From April 13 to April 17 (ET), spot Bitcoin ETFs recorded net inflows of $996 million, marking the third consecutive week of net inflows. Spot Ethereum ETFs saw net inflows of $276 million. SOL spot… pic.twitter.com/LxcdbPFDDC
— Wu Blockchain (@WuBlockchain) April 20, 2026

What the Charts Show
Technically, XRP is in a defined range. The daily chart shows support holding around $1.35 and resistance capping moves at $1.50. The MACD is slowly turning upward, and histogram bars are shrinking, which suggests bearish momentum is fading.
The Relative Strength Index sits near 54, a neutral reading. Neither buyers nor sellers are in control at this point.
Crypto analyst Ali Charts noted on X that XRP is forming a symmetrical triangle, a pattern that typically resolves with a sharp move in one direction. Ali Charts said the pattern points to a potential 35% move, though the direction was not specified.
$XRP consolidates in a symmetrical triangle, pointing to a potential 35% move. pic.twitter.com/3RYgMxq4ag
— Ali Charts (@alicharts) April 19, 2026
Longer-term, the picture is more cautious. XRP peaked above $3.00 in mid-2025 before falling steadily through lower highs and lower lows. A heavy-volume sell-off in early February 2026 cleared out weaker holders and reset positioning, but price has barely moved since.
XRP’s 30-day Realized Volatility Index has dropped to around 0.42, the lowest reading since 2024. Historically, this kind of compression tends to come before a large move rather than extended sideways trading.
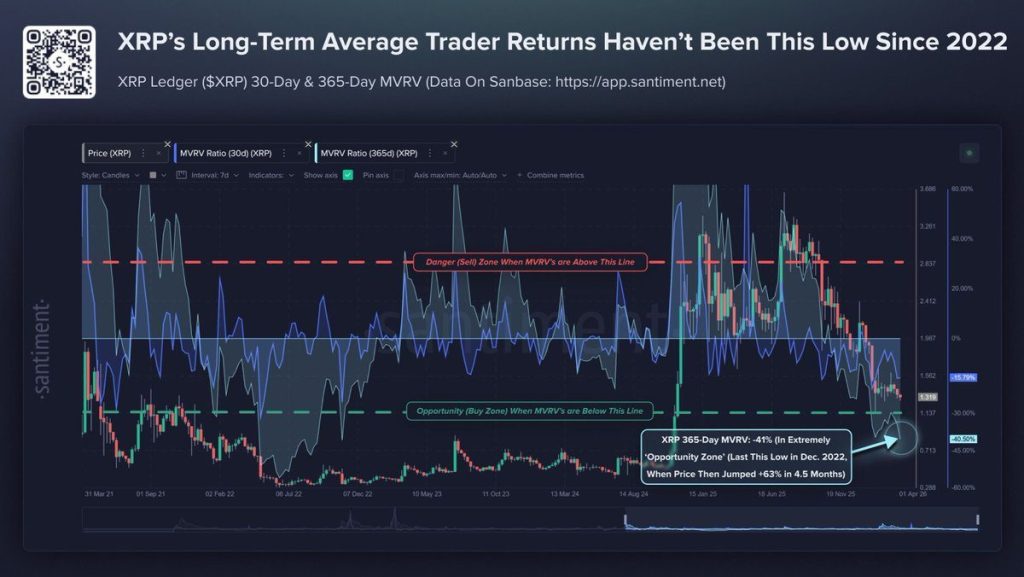
On-chain data shows most holders are still underwater. The MVRV ratio is at levels seen during past periods of market stress, and the supply in profit remains low. XRP is also down around 30% over the past year.
The immediate level to watch is $1.50. A clean break and hold above that mark would be the first clear sign of a trend shift. If $1.30 gives way, there is limited visible support beneath it.


