


 Price: Cumulative ETF Inflows Hit $1.39 Billion as Price Stalls Below Resistance")


TLDR
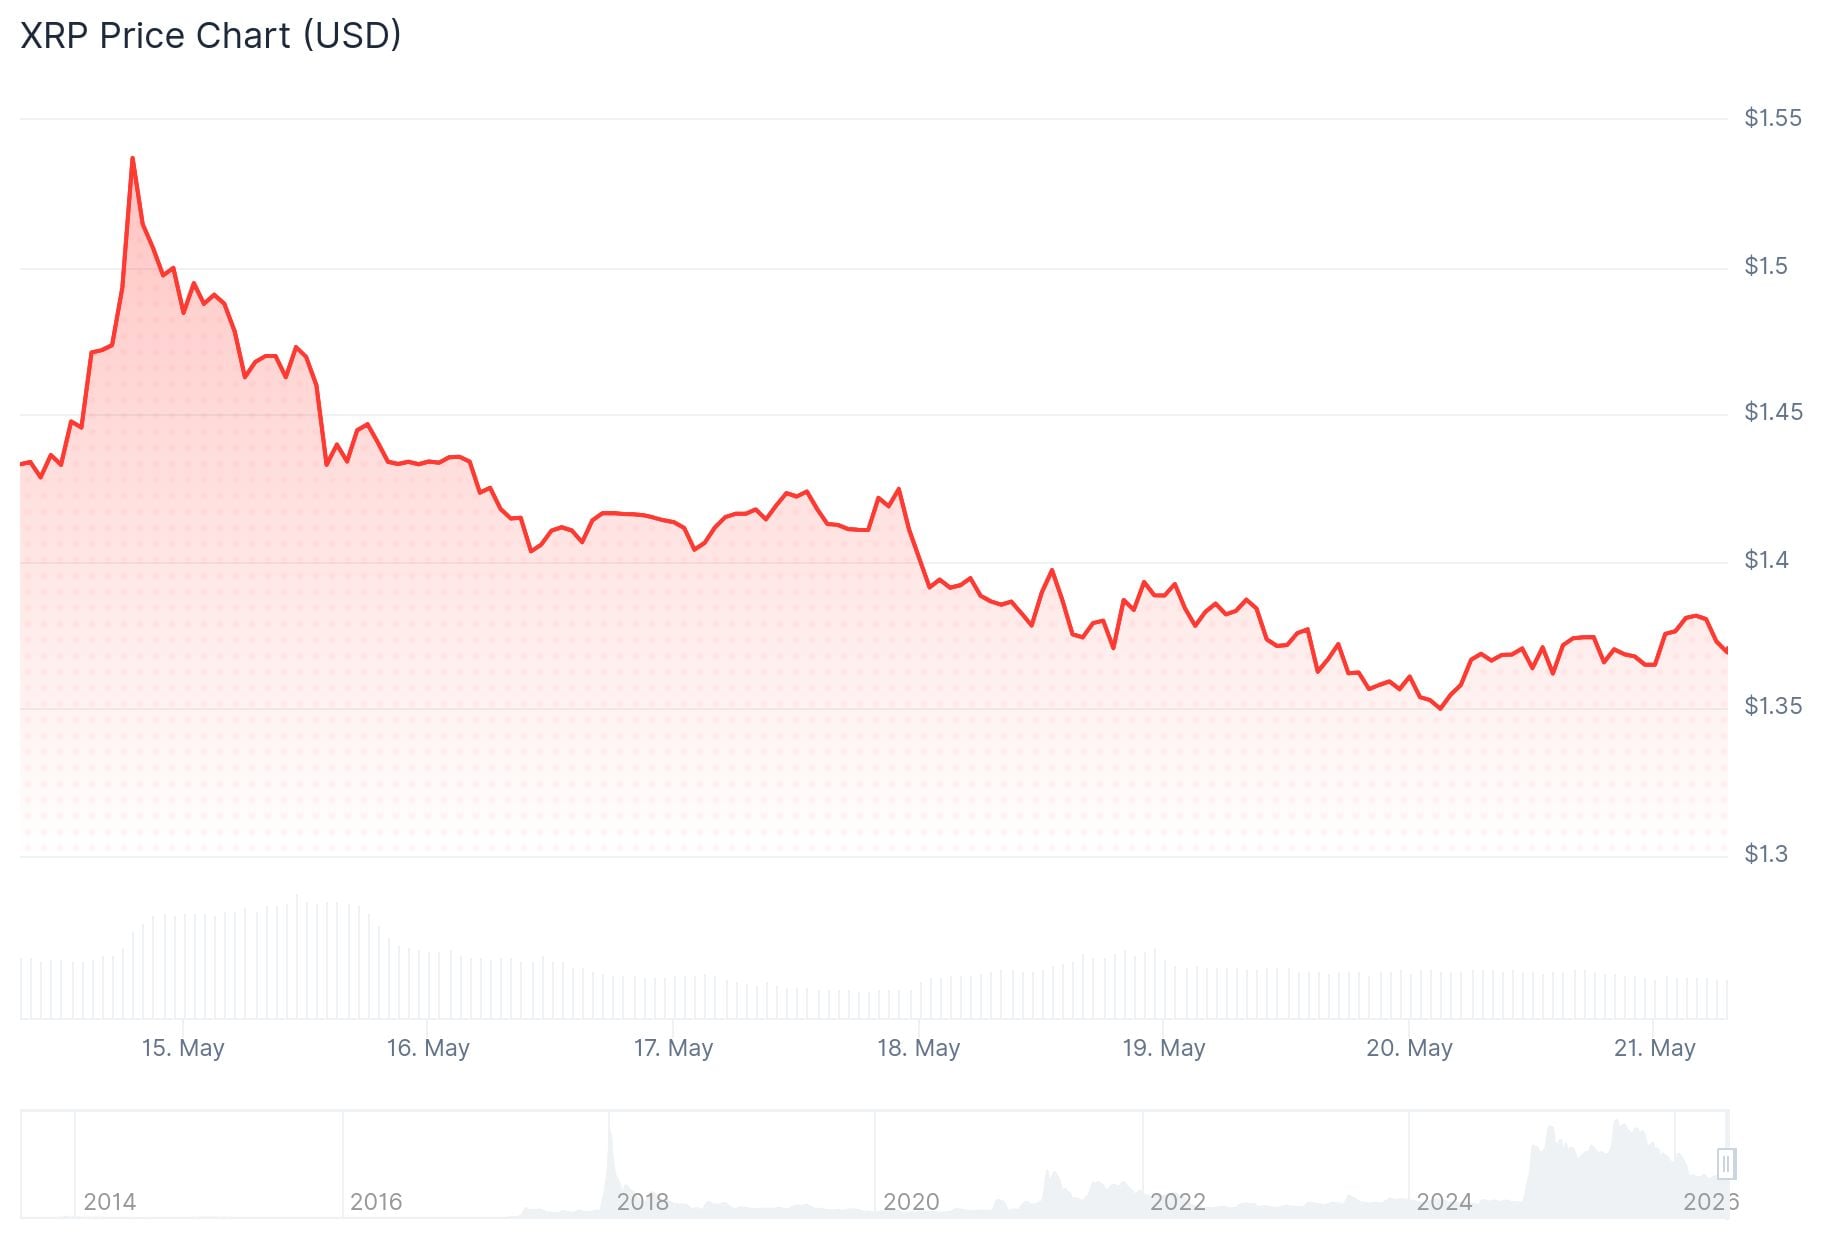
- XRP is trading around $1.37, having bounced off short-term support at $1.35
- XRP ETF inflows have risen for four consecutive days, reaching $1.48 million on Tuesday
- Open Interest in XRP futures climbed to $2.93 billion, up from $2.83 billion
- XRP remains below its 50, 100, and 200-day EMAs, keeping the near-term outlook bearish
- The key resistance to watch is $1.3940; a break could open the path to $1.42 and beyond
XRP is trading at $1.37 on Wednesday, May 21, after bouncing off a short-term support level at $1.35. The recovery comes after XRP was rejected at $1.50 in mid-May.
That rejection was driven partly by macroeconomic pressure, including hotter-than-expected US inflation data and ongoing geopolitical tensions in the Middle East.
The Federal Reserve is set to release the minutes from April’s policy meeting at 18:00 GMT on Wednesday. Traders will be watching closely for signals on the Fed’s policy direction.
XRP spot ETFs have seen inflows for four straight days. On Tuesday, inflows came in at $1.48 million, up from $750,000 the day before. Cumulative inflows now sit at $1.39 billion, with net assets under management averaging $1.12 billion, according to SoSoValue data.

Analyst ChartNerd (@ChartNerdTA) highlighted on social media that $1.30 is the next key defence level if XRP loses its current structural support. “The more we hit our heads and fail to push through $1.50, the likelihood of a larger drop increases,” the analyst wrote, flagging that signs of weakness are already appearing.
The next line of $XRP defence after losing structural ascending support rests around $1.30. Signs of weakness are appearing. $1.50 remains the major resistance to break: the more we hit our heads and fail to push through, the likelihood of a larger drop increases #NFA https://t.co/x1DR4gOr79 pic.twitter.com/blTdrm8vS9
— 🇬🇧 ChartNerd 📊 (@ChartNerdTA) May 20, 2026
XRP futures Open Interest rose to $2.93 billion on Wednesday, up from $2.83 billion the previous day. A continued rise in OI could help push price toward the $1.40 level.

Technical Levels to Watch
XRP is currently trading below its 50-day, 100-day, and 200-day Exponential Moving Averages, sitting at $1.41, $1.48, and $1.69 respectively. This positioning keeps the near-term bias bearish.
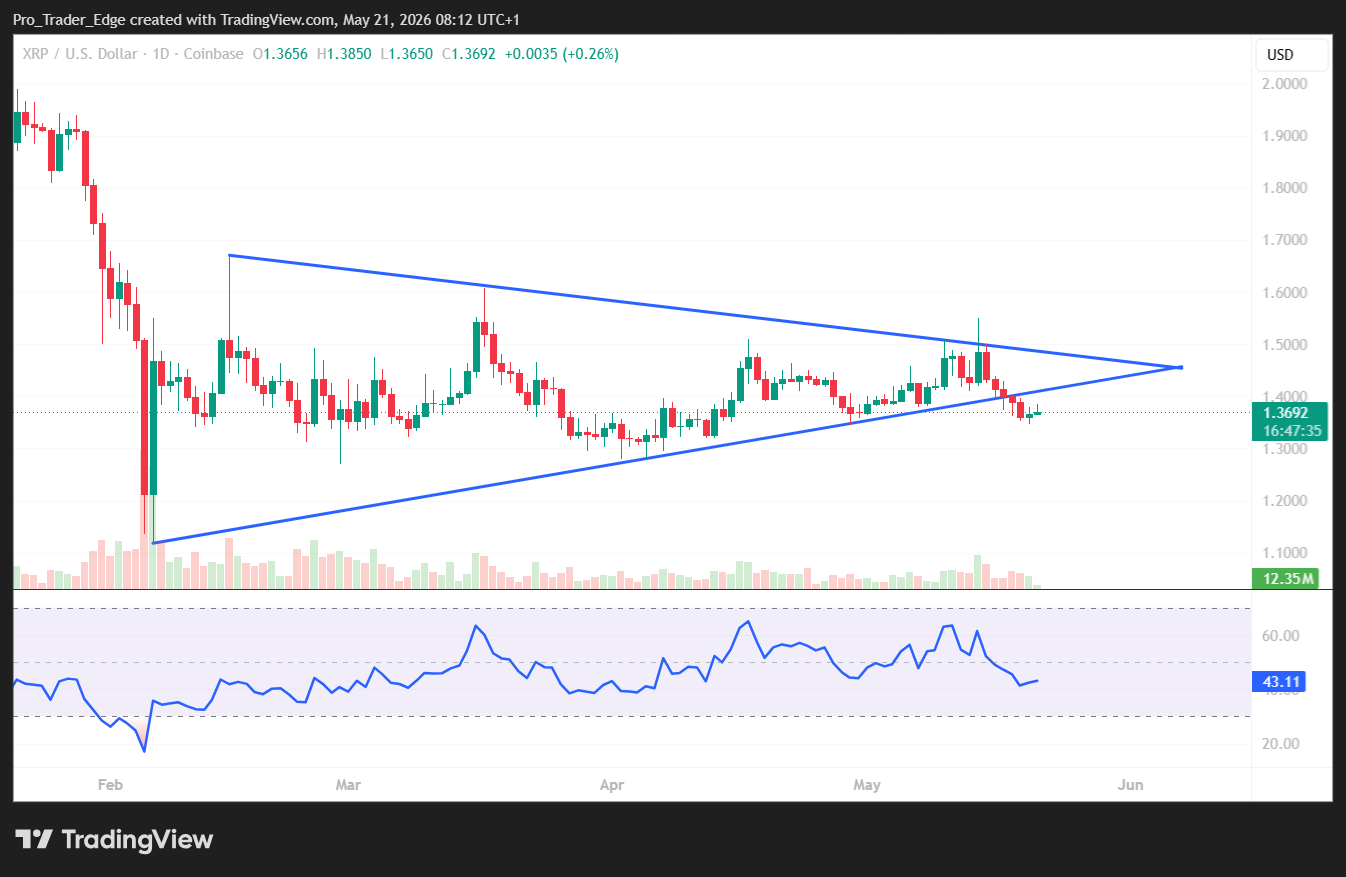
The RSI is sitting in the low-40s on the daily chart, and the MACD histogram is negative and slipping. These readings suggest bearish momentum has not yet fully eased.
On the hourly chart, there was a break above a declining channel with resistance at $1.380. However, bears have been active near the $1.3820 zone.
The first major resistance level is at $1.3940. A close above that level could push XRP toward $1.42.
What Happens If XRP Fails to Break Higher
If XRP cannot clear $1.3940, a fresh drop is possible. Initial support sits at $1.3620, followed by $1.3550.
A break below $1.3550 could lead to a retest of $1.3450 and potentially $1.3350. Below that, $1.32 comes into view.
On the upside, clearing $1.3940 opens the path to $1.4720, which is the 61.8% Fibonacci retracement of the move from $1.5495 down to $1.3465.
A sustained move above $1.4720 could then target the $1.50 resistance level and, if that breaks, $1.52.
XRP futures Open Interest remains at $2.93 billion as of Wednesday, with ETF inflows maintaining a four-day positive streak at $1.39 billion cumulative.


