


TLDR
- XRP has posted six consecutive monthly losses — the first time since 2014 — falling over 60% from its $3.65 cycle high.
- The token dropped from $1.37 to $1.33, with sellers using every rally to exit positions near the $1.37–$1.38 resistance zone.
- Ripple-linked ETF products saw $3.32M in inflows, a shift from March outflows, but not enough to reverse the price slide.
- Whale wallets added over 11 million XRP per day on a 30-day average as of April 6, according to CryptoQuant data.
- XRP only needs a monthly close above $1.33 to break its losing streak, with the CLARITY Act and Bitcoin’s recovery cited as potential catalysts.
XRP has now fallen for six months in a row, the longest losing streak for the token since 2014. The price is down more than 60% from its cycle high of $3.65, reached last July. Despite a brief push toward $1.40, sellers have returned and kept the price under pressure.
The decline started in October 2025 when Trump’s 100% China tariff announcement triggered the largest single-day crypto liquidation in history. Over $19 billion in leveraged positions were wiped out in under 24 hours. XRP fell from above $2.80 to below $2.00 in the days that followed.
Recovery attempts in November and December were cut short by ETF outflows and fading institutional confidence. Then, in late February 2026, the Iran conflict escalated and oil prices surged above $100 after the Strait of Hormuz was closed.
The Federal Reserve responded by raising its inflation forecast, pushing institutional money out of risk assets. XRP catalysts in 2026 — including a commodity classification, ETF inflows, and Ripple partnership announcements — were unable to overcome those macro conditions.
Selling from XRP’s own holders added further weight. Around 60% of XRP’s circulating supply is held at a loss. Each time the price bounced toward the $1.44 average cost basis, underwater holders sold to exit. That pattern repeated on every bounce from November through March.
Sellers Stay in Control Near Key Resistance
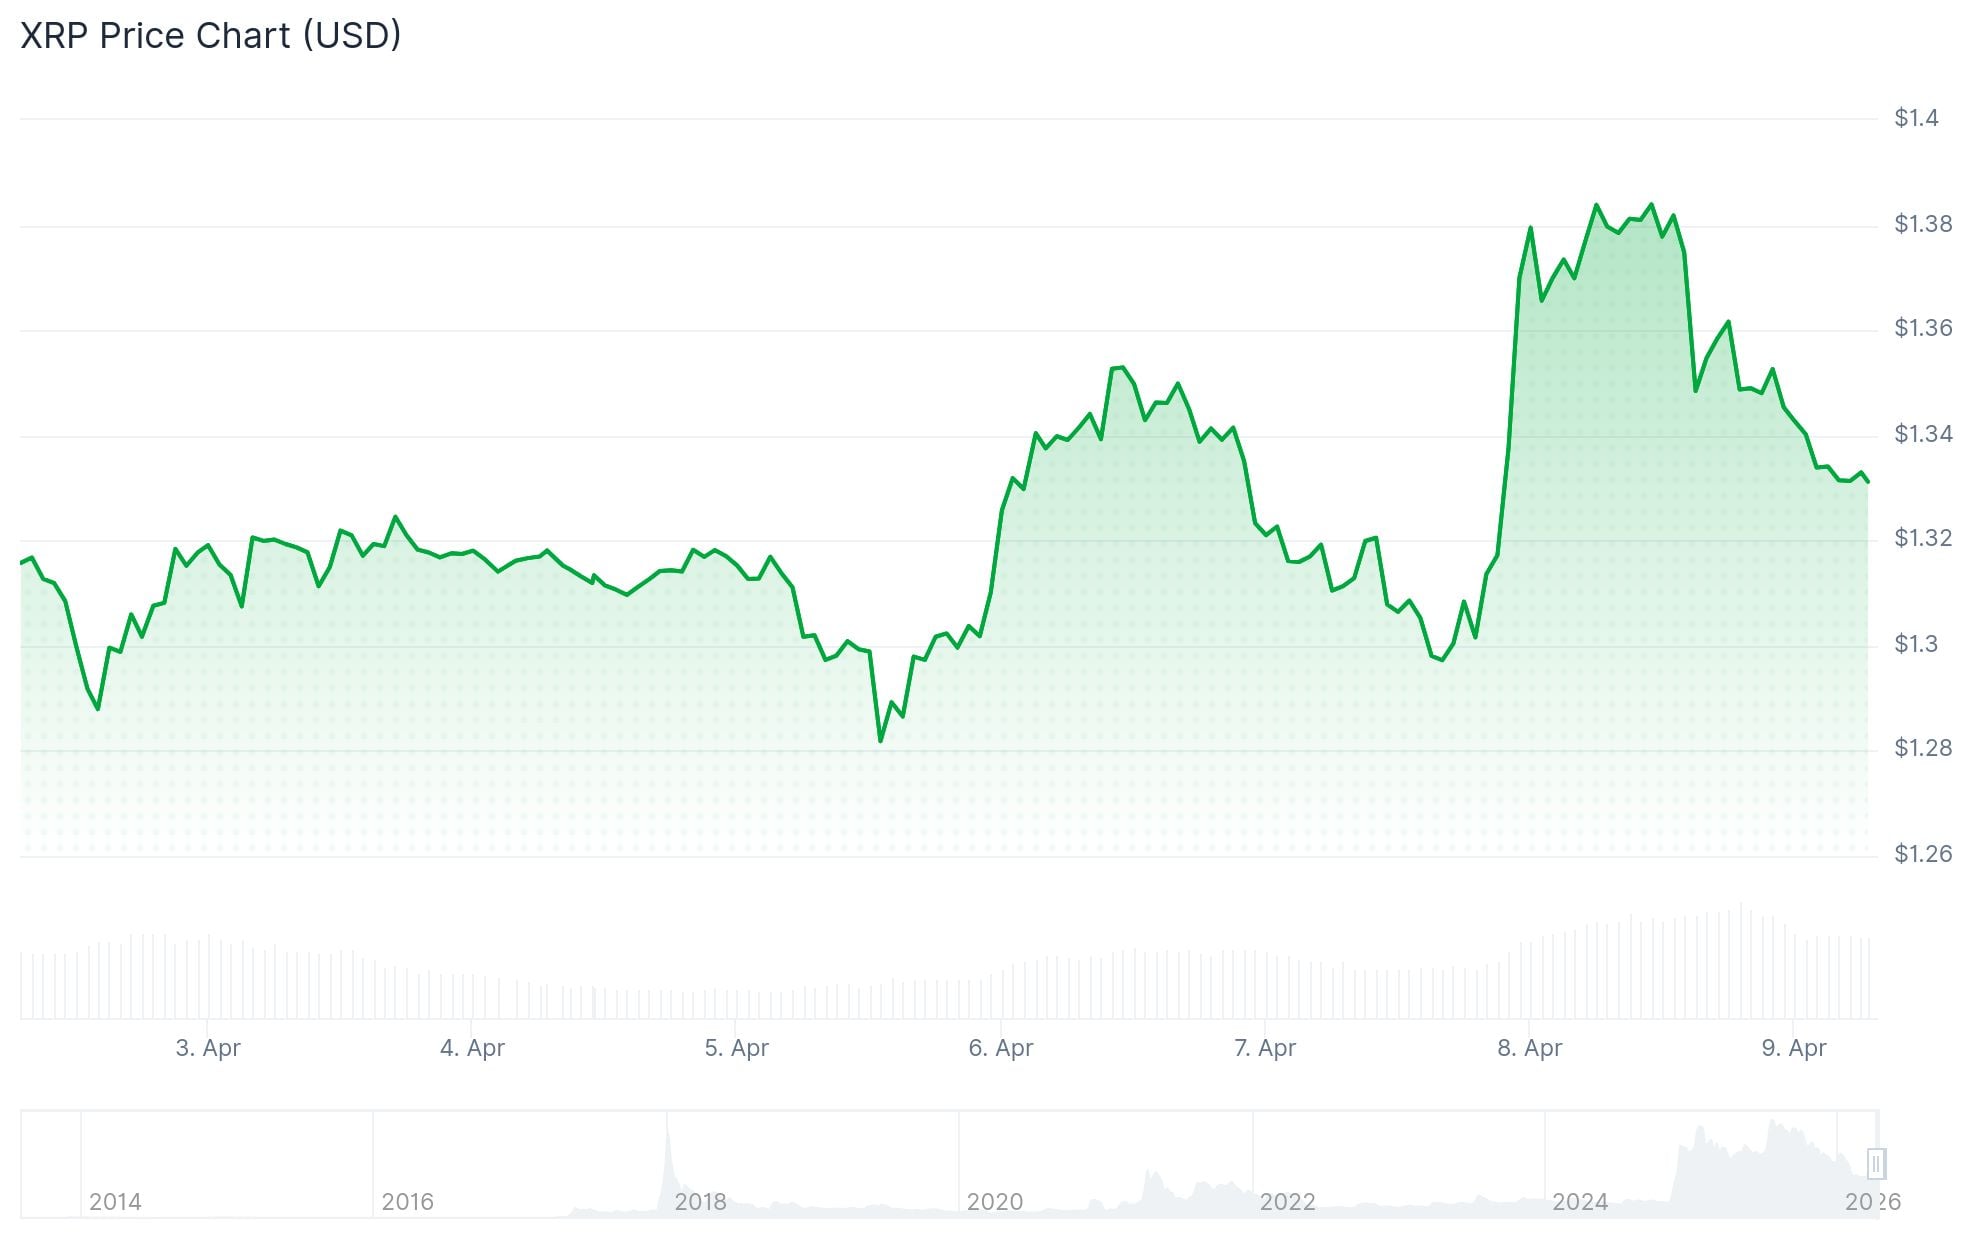
On the hourly chart, XRP declined from $1.37 to $1.33, with the breakdown picking up speed after rejection near $1.38. High-volume selling confirmed the move. Late in the session, price touched $1.31 before a minor stabilization, though recovery attempts stayed weak.
$XRP Bull Market Scenario pic.twitter.com/KJj0u5yIm6
— CW (@CW8900) April 8, 2026

A bearish trend line has formed with resistance at $1.3550. XRP is trading below the 100-hourly Simple Moving Average. Rising volume alongside falling prices points to distribution rather than accumulation.
Ripple-linked ETF products recorded $3.32M in inflows, a shift from March outflows. However, exchange liquidity has thinned, which increases the risk of sharper moves if key support levels break. The immediate support sits at $1.33, with the key level to watch at $1.28.
ETF FLOWS: US SPOT CRYPTO ETFs FLOWS DATA UPDATE (07-04-2026):
🟥 Bitcoin ETFs: -2,318 $BTC (-$159.05M)
🟥 Ethereum ETFs: -30,850 $ETH (-$64.67M)
🟥 SOLANA ETFs: -190.56K $SOL (-$15.40M)
🟩 XRP ETFs: +2.54M $XRP (+$3.32M)
🟩 HBAR ETFs: +5.46M $HBAR (+$472.05K)
🟩 $LINK, $LTC,… https://t.co/UvnZL0A6fH pic.twitter.com/OGCtMuTHAQ— Crypto Patel (@CryptoPatel) April 8, 2026
Whale Accumulation Hits 10-Month High
CryptoQuant data from April 6 shows whale accumulation at a 10-month high. Large wallets have been adding over 11 million XRP per day on a 30-day average. Exchange outflows have also accelerated, reducing the supply available to sell.
XRP led all crypto assets in ETF inflows last week with $120 million. Bitcoin has climbed above $71,000 and XRP is currently trading above $1.35.
XRP closed March at $1.33. A monthly close above that level would end the six-month losing streak. The CLARITY Act, which would permanently classify XRP as a digital commodity under federal law, could move forward if the Senate Banking Committee completes its markup in late April.


