


 Boom – Here’s Why It Matters")


TLDR
- Solana’s real-world asset (RWA) issuance has surged 140.6% year-to-date, reaching $418 million
- Circle minted $250 million USDC on Solana in just 24 hours, signaling increased liquidity
- SOL broke above $155 resistance level, opening path toward $180 target
- Technical analysis shows SOL holding above 200-day EMA and key trendline support
- First Solana ETF approval drove 7% weekly gains, nearing $100 million in assets under management
Solana has broken through a crucial resistance level near $155, setting the stage for a potential move toward $180. The breakout comes as the blockchain sees rapid growth in real-world asset tokenization and fresh capital inflows.

The network’s RWA sector has expanded dramatically this year. According to Messari data, Solana has now surpassed $418 million in total RWA issuance, marking a 140.6% increase year-to-date. This includes tokenized U.S. Treasuries and assets like Tesla shares, with USDY and OUSG leading the charge.
Assets like TBILL, ACRED, and BUIDL are steadily appearing on-chain. This shift positions Solana as a serious platform for institutional-grade financial products.
The momentum extends beyond RWAs. SolanaFloor reported that Circle minted 250 million USDC directly on Solana in the last 24 hours alone. This large-scale minting suggests deeper liquidity ahead, whether to back RWAs or support upcoming on-chain funds.
Technical Breakout Opens Path to $180
Solana cleared a major horizontal resistance at $155 after several days of price action being capped at this level. The clean push above this barrier now opens the path toward the $180 region, aligned with May 2025 highs.
The breakout tracks closely with Solana’s growing fundamental momentum. From a technical standpoint, price is now moving through a vacuum zone with limited resistance until $180. The key level to watch is $167, where a close above would likely accelerate trend continuation.
AltWolfCrypto highlights a clean technical setup on Solana’s daily chart. Price is riding a well-respected trendline from June lows and holding above the 200-day EMA. The $158 to $160 zone has become a key pivot area with confluence of horizontal support, diagonal trendline, and EMA structure.

This makes it a crucial level for both breakout validation and trend continuation. As long as Solana continues to bounce off this ascending support and the 200EMA holds as a dynamic floor, the chart favors the bullish scenario toward $180 to $185.
Analyst Targets $290 Level
Crypto analyst CW8900 identifies two major sell walls on Solana’s path. One sits near the $180 zone, with another much higher at just under $290. With SOL currently trading around $160s, the structure suggests limited resistance until $180, where prior distribution occurred in May.
$SOL has two sell walls. pic.twitter.com/34Gs6eqjnw
— CW (@CW8900) July 14, 2025
Volume has steadily climbed into this region, hinting at renewed momentum. However, the $180 area remains the key ceiling to break.
If Solana can push through and confirm a breakout above $180 with strong follow-through, the technical vacuum between $180 and $290 opens up. This was previously a high-volume node during Solana’s rally.
ETF Approval Drives Institutional Interest
The approval of the first Solana ETF in the United States has boosted institutional interest. The REX-Osprey SOL + Staking ETF (SSK) is already nearing $100 million in assets under management. This launch marks a pivotal moment for altcoins as it opens floodgates for institutional capital inflows.
LuxAlgo recently identified a symmetrical triangle that has reached a tipping point. While price could break out in any direction theoretically, since SOL is on an uptrend, maintaining the current trajectory is the most probable outcome.
Make no mistake – this $SOL setup is not one you want to ignore. pic.twitter.com/aNeaUPnuH3
— LuxAlgo (@LuxAlgo) July 15, 2025
The technical setup shows SOL has broken above a descending price channel. This breakout came alongside a bullish crossover between the 9-day and 21-day exponential moving average.
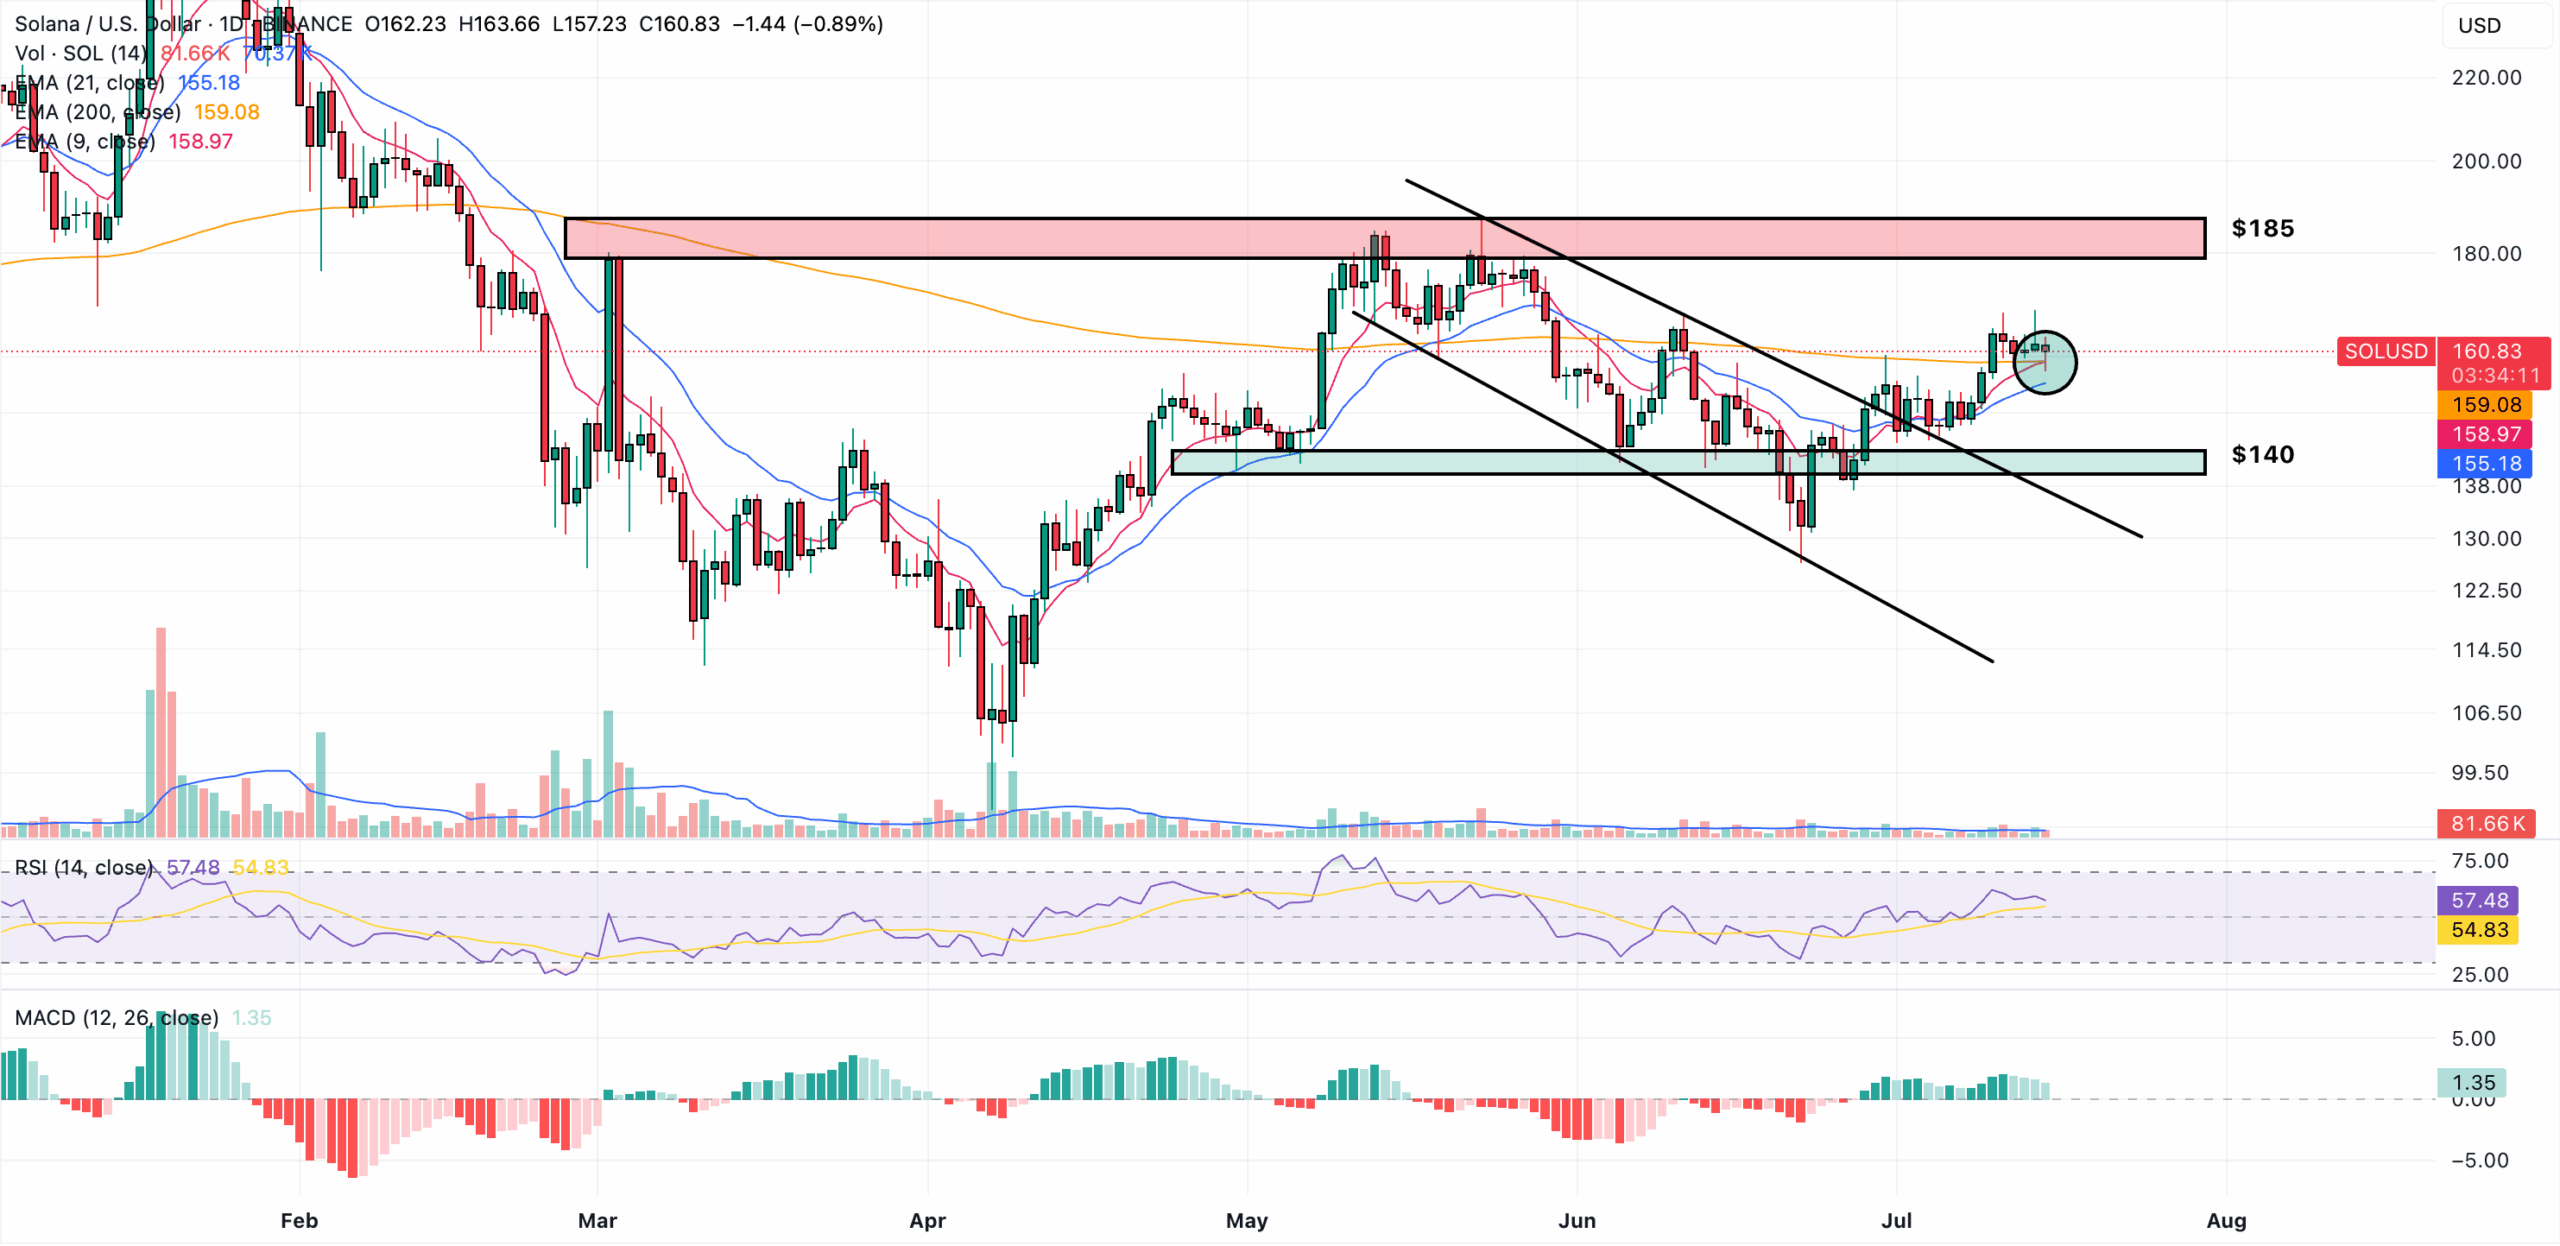
A powerful ‘golden cross’ would occur when the 9-day and 21-day EMA cross above the 200-day EMA. This could set off an explosive move for SOL toward the $185 resistance level.
The Relative Strength Index also indicates the latest uptrend has gained strength. It has moved above the 14-day moving average and departed from the mid-line.
Circle’s $250 million USDC mint represents the largest single-day issuance on Solana in recent months, providing the liquidity infrastructure needed for continued growth in both RWA and DeFi sectors.


