


 Price: A Bullish Chart Pattern Is Brewing — But SOL Must Clear This One Level First")


TLDR
- SOL is forming a monthly cup and handle pattern after recovering from its 2022 lows
- The $78–$98 channel has defined price action since February, with $88 as the mid-pivot
- Analyst Ali Charts says a daily close above $98 could push SOL toward $107 and $117
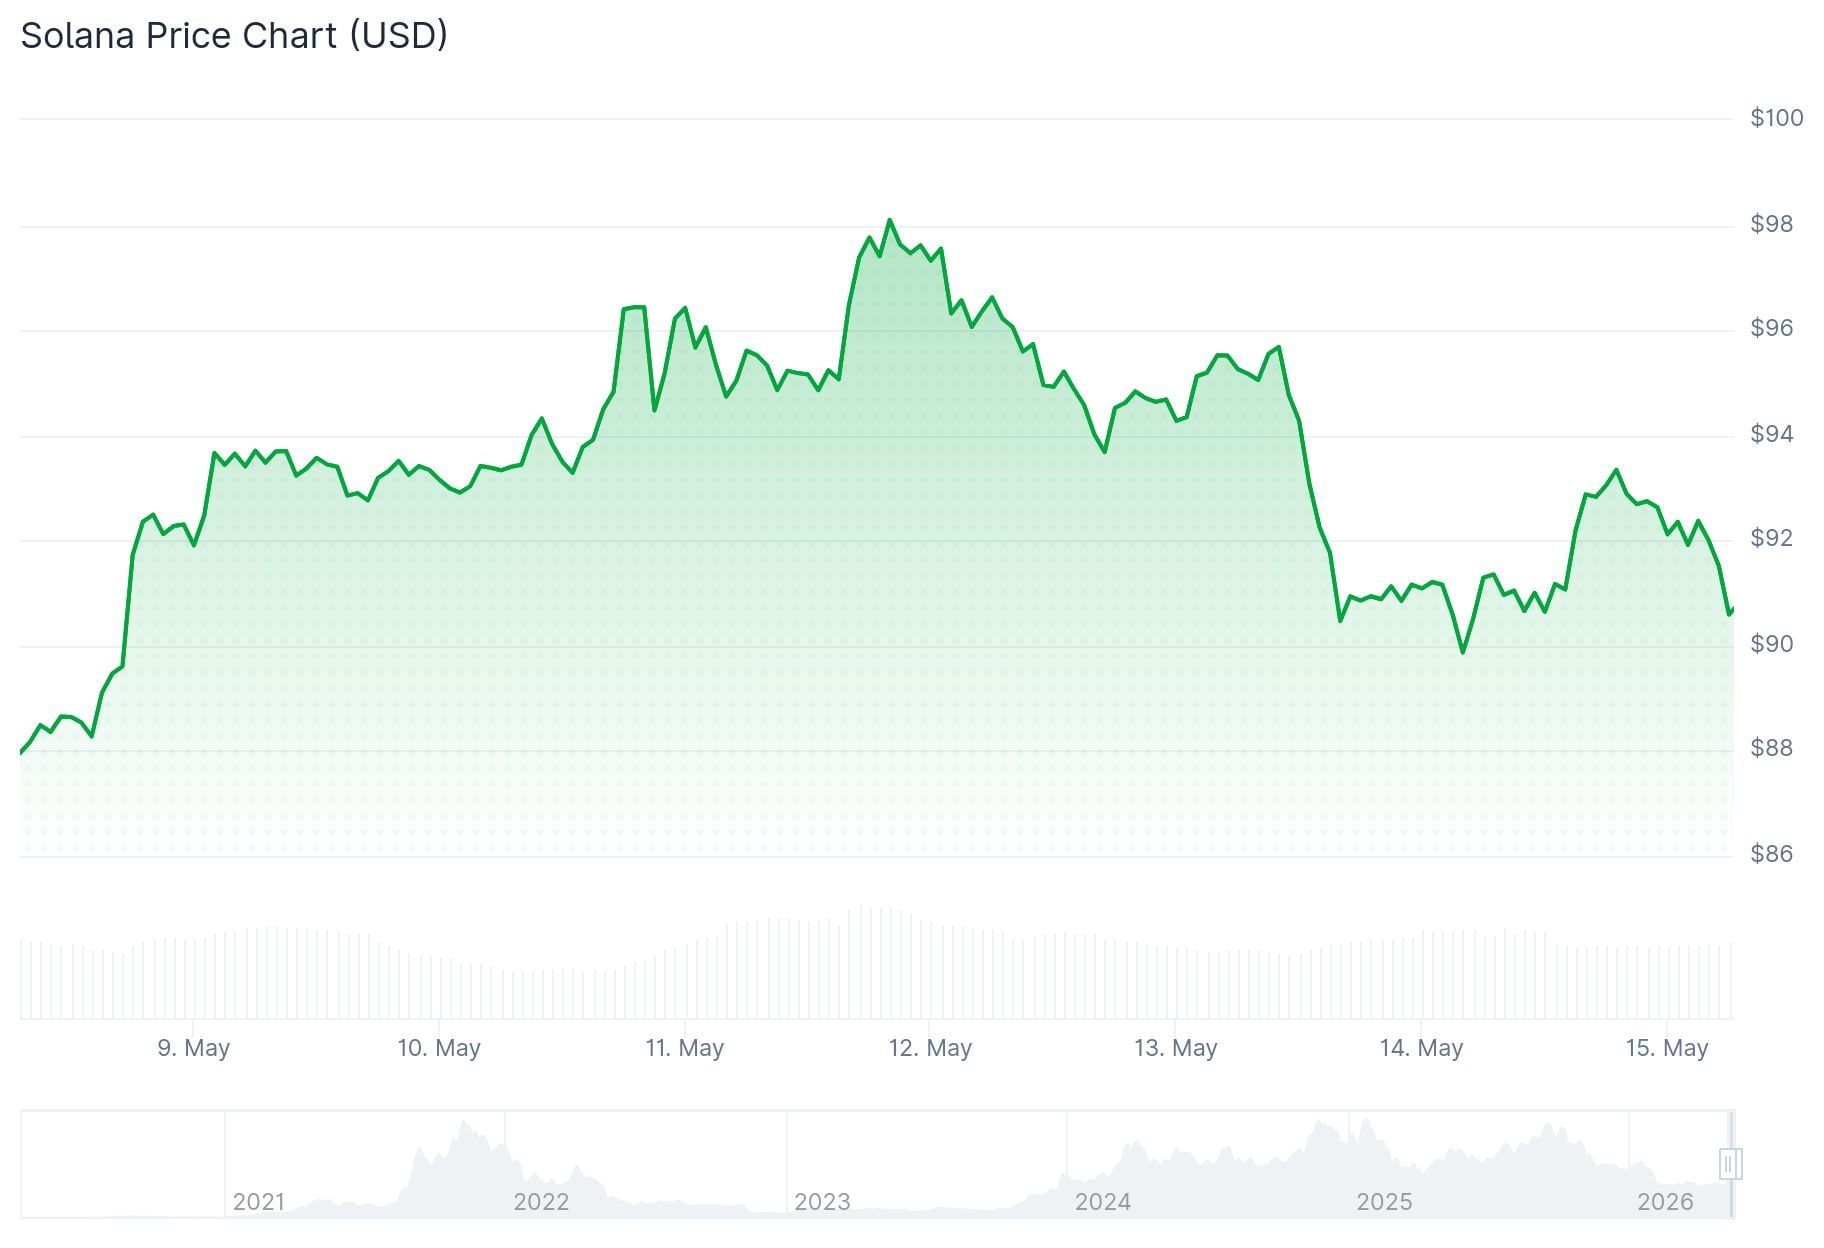
- SOL broke out of a long-term descending channel and is consolidating between $92–$95
- Key support levels to watch are $92, $89, and $78 — losing $78 would weaken the bullish structure
Solana is holding above key support while a large monthly cup and handle pattern develops. The chart structure stays constructive for now, but confirmation depends on SOL defending support and breaking above $98.
Since February, SOL has been trading inside a channel with a floor at $78 and a ceiling at $98. Analyst Ali Charts identified these boundaries, with $88 acting as the current pivot point.
SOL recently tested the $98 resistance and was rejected quickly. Ali Charts noted that price has since bounced, suggesting another retest of the $98 ceiling could be building.
Ali Charts stated that a daily close above $98 would likely push SOL toward $107 first, with a secondary target at $117. If $98 continues to hold as resistance, a pullback to $88 or a full reset to $78 is possible.
$98 is the level that could signal a bullish breakout for Solana.
Since February, $SOL has been moving within a well-defined channel. I’ve identified the boundaries at $78 (Floor) and $98 (Ceiling), with $88 as the current pivot point.
We recently tested that $98 resistance,… pic.twitter.com/E1ntBJZHZH
— Ali Charts (@alicharts) May 14, 2026
Monthly Cup and Handle in Play
On the monthly chart, Bitcoinsensus identified a large cup and handle formation. SOL dropped from its 2021 high, bottomed out through 2022 and 2023, then recovered toward the old resistance zone.
The handle is now forming as a sideways cooldown phase. SOL is trading near the lower edge of the handle, making that trendline a key area for buyers to defend.

The pattern is not yet confirmed. SOL needs to break above the upper handle trendline and push through the wider resistance near the 2021 highs before the setup activates.
Breakout From Descending Channel
Analyst CryptoXLARG noted that SOL has broken out of a long-term descending channel. Price is now consolidating in the $92–$95 range as it builds a base for a possible trend reversal.
$SOL has broken out of a long-term descending channel and is now consolidating around the $92–$95 range, signaling a potential trend reversal after a broader base formation.
A sustained move above $95 is key. If confirmed, the next targets are $102.70 followed by $106.50 and… pic.twitter.com/6JyagUMOgF
— 𝐂𝐫𝐲𝐩𝐭𝐨𝐗𝐋𝐀𝐑𝐆𝐄 (@CryptoXLARG) May 13, 2026
A sustained move above $95 would open targets at $102.70, $106.50, and $118.26. In a strong momentum environment, CryptoXLARG sees macro targets as high as $143 and $163 as possible extensions.
Analyst Bitcoin Meraklısı noted that SOL hit its first upside target after a nearly 10% breakout rally, but sellers stepped in. A dip toward $92 still fits within a healthy structure.
$92 is the immediate support floor. Below that, $89 and $78 are the next levels. Losing $78 would invalidate the current bullish structure.
Analyst Moe noted that SOL has moved back above a long-term descending trendline from the 2021 high, suggesting the larger downtrend structure has weakened. SOL continues to hold above that broken trendline.


