


 Price: Bears Get Squeezed as SOL Rallies Back Above $90 – What’s Next?")
TLDR
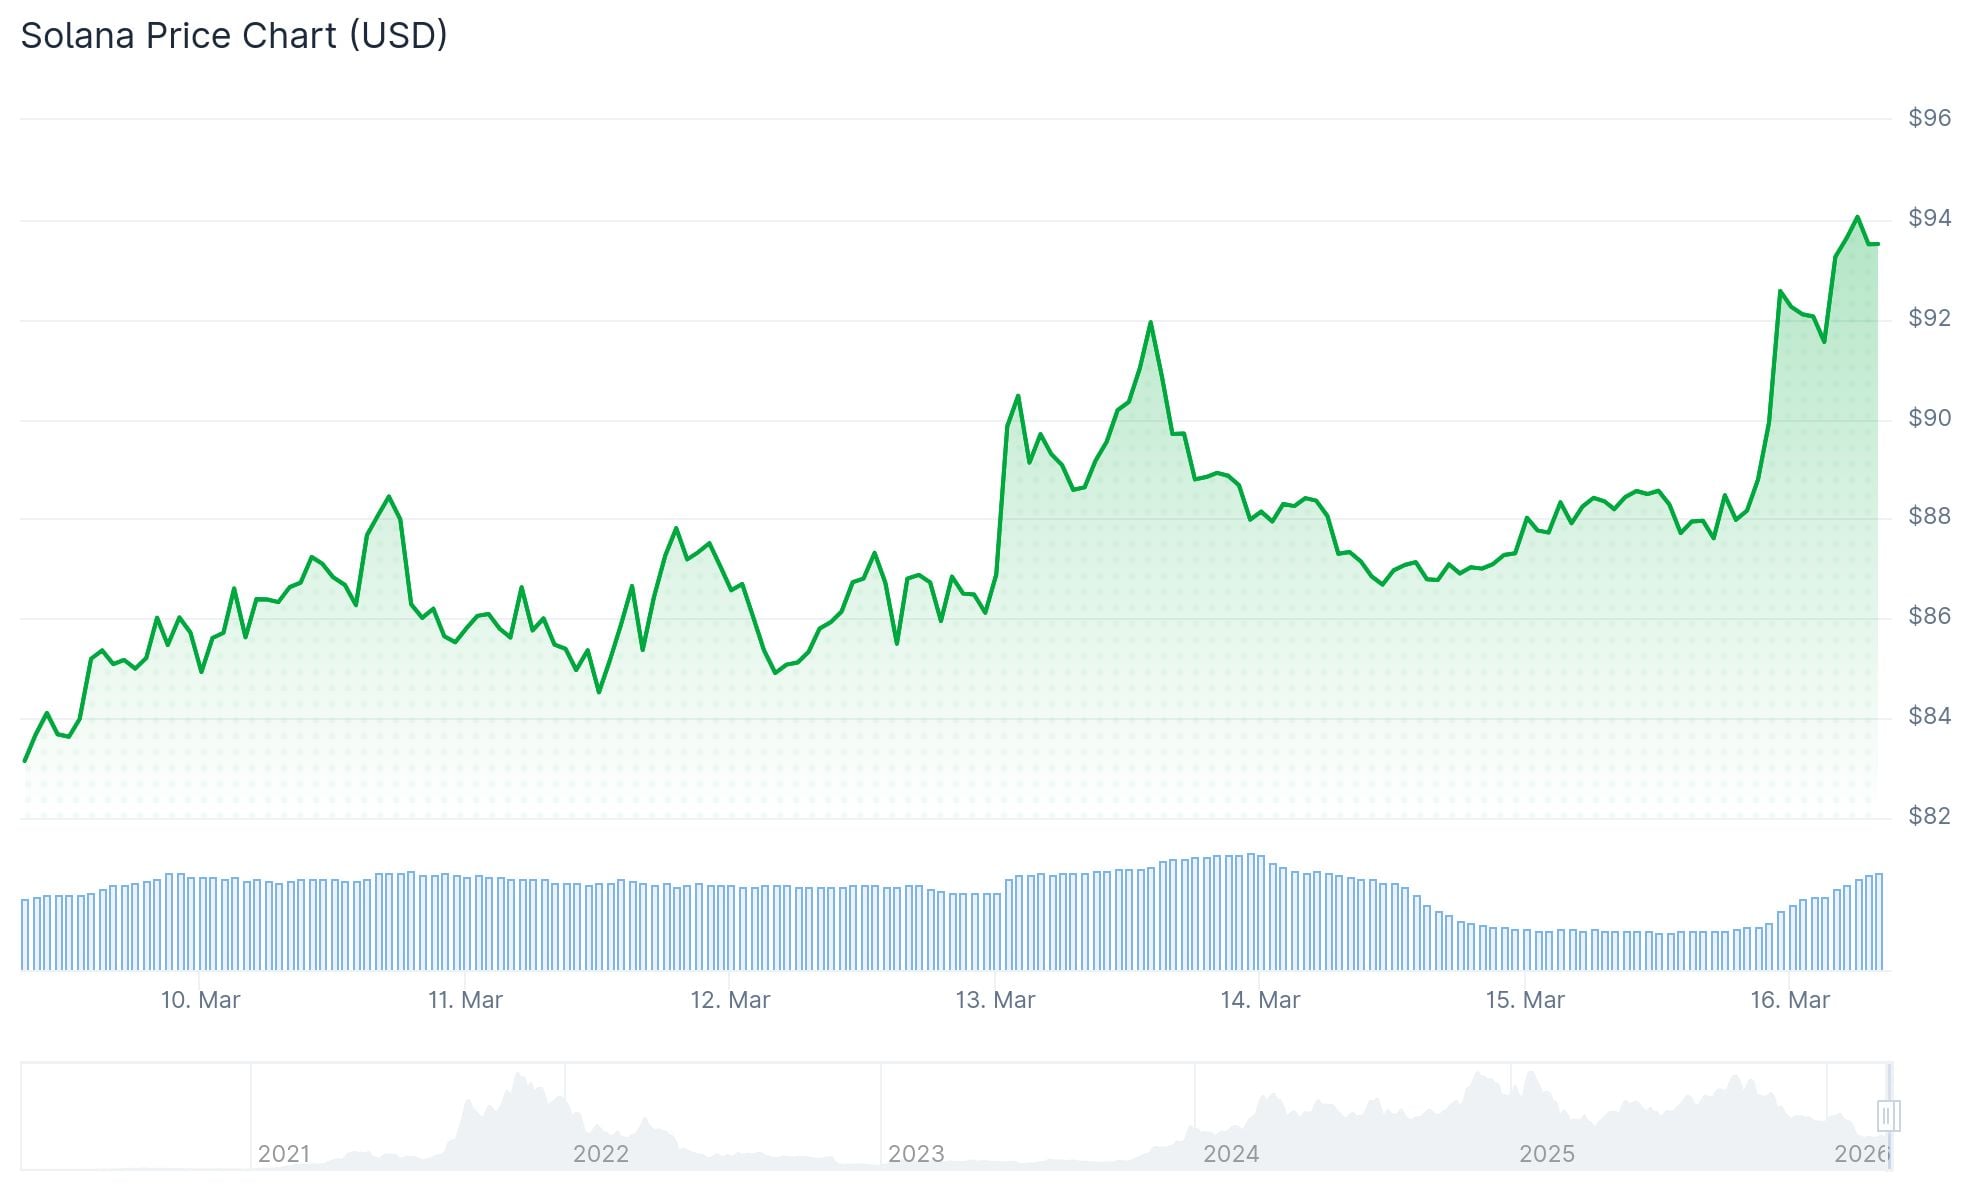
- SOL is trading around $92–$93, up roughly 4–5% on the day, after a 13% rise the previous week.
- SOL ETFs recorded $10.70 million in net weekly inflows, showing continued institutional interest.
- Open Interest in SOL futures rose over 7% in 24 hours to $5.57 billion, with $14.43 million in short liquidations.
- Key technical resistance sits at the 50-day EMA of $94.17, with the next target at the 100-day EMA of $109.58.
- Tokenized real-world assets on Solana have reached roughly $873 million, according to Bitwise estimates.
Solana is showing signs of recovery after a sharp pullback from its January 2026 peak near $295. The token has gained around 13% over the past week and is now trading in the $92–$93 range.
SOL-focused ETFs brought in $7.60 million on Friday alone, pushing the weekly total to $10.70 million. These consistent inflows point to steady institutional buying even during the recent price decline.
On the derivatives side, futures Open Interest climbed more than 7% in 24 hours to $5.57 billion. Short positions took a hit, with $14.43 million of the $15.50 million in total liquidations coming from bearish trades.
$SOL/monthly
Textbook Cup and Handle pattern on #Solana 📈
Nothing complicated here — just follow basic TA. The pattern is clear, the setup is bullish.
The only question is whether you have the faith to act on it 💭 pic.twitter.com/vnNEAp1bzy
— Trader Tardigrade (@TATrader_Alan) March 13, 2026
The current price sits just below the 50-day Exponential Moving Average of $94.17. A daily close above that level would open the door to a run toward the 100-day EMA at $109.58.
Momentum indicators are turning positive. The MACD has entered positive territory and the RSI sits at 58, above the midline.
Real-World Asset Growth Supports Solana’s Case
One of the bigger stories behind SOL’s recovery is the growth of real-world asset tokenization on the network. Bitwise estimates tokenized RWAs on Solana have hit roughly $873 million, covering on-chain treasuries, private credit, and yield products.

Spot Solana ETFs, approved in late 2025, have continued attracting capital even during periods of negative price action. These products are now being used by traditional finance investors who want SOL exposure without managing wallets directly.
From March 9 to March 13 (ET), Bitcoin spot ETFs recorded net inflows of $767 million, marking three consecutive weeks of net inflows. Ethereum spot ETFs saw $161 million in net inflows, also extending their three-week inflow streak. SOL spot ETFs posted $10.7 million in net… pic.twitter.com/slBc1GuHw6
— Wu Blockchain (@WuBlockchain) March 16, 2026
On-chain activity backs this up. Active addresses have climbed above 5 million and daily transactions are approaching 87 million.
Network and Supply Context
The Solana validator set now counts more than 2,000 validators by some estimates, though active validators may be closer to 795. The Solana Foundation’s share of staked SOL has dropped from over 40% in 2020 to under 6% by late 2025.
Network inflation runs around 4% annually. About 67% of SOL is currently staked, reducing freely circulating supply.
Funding rates on perpetual swaps are near flat to slightly negative at around −0.0095% per day. That suggests longs are not yet piling in aggressively.
Downside support sits in the $76–$80 range. Major resistance remains near $245–$250, the area of the January peak.
As of now, SOL is trading at approximately $92–$93 with the 50-day EMA at $94.17 acting as the immediate ceiling.


