TLDR
-
Solana price has broken out of a bull flag, signaling a move toward $280–$300.
-
Analysts project an upside of 66.12% based on the breakout structure.
-
Key resistance levels include $200, $206, and $280, with support at $187.
-
Technical indicators like MACD, RSI, and moving averages support the bullish outlook.
-
Volume is rising and momentum remains strong, with traders targeting $220–$294 next.
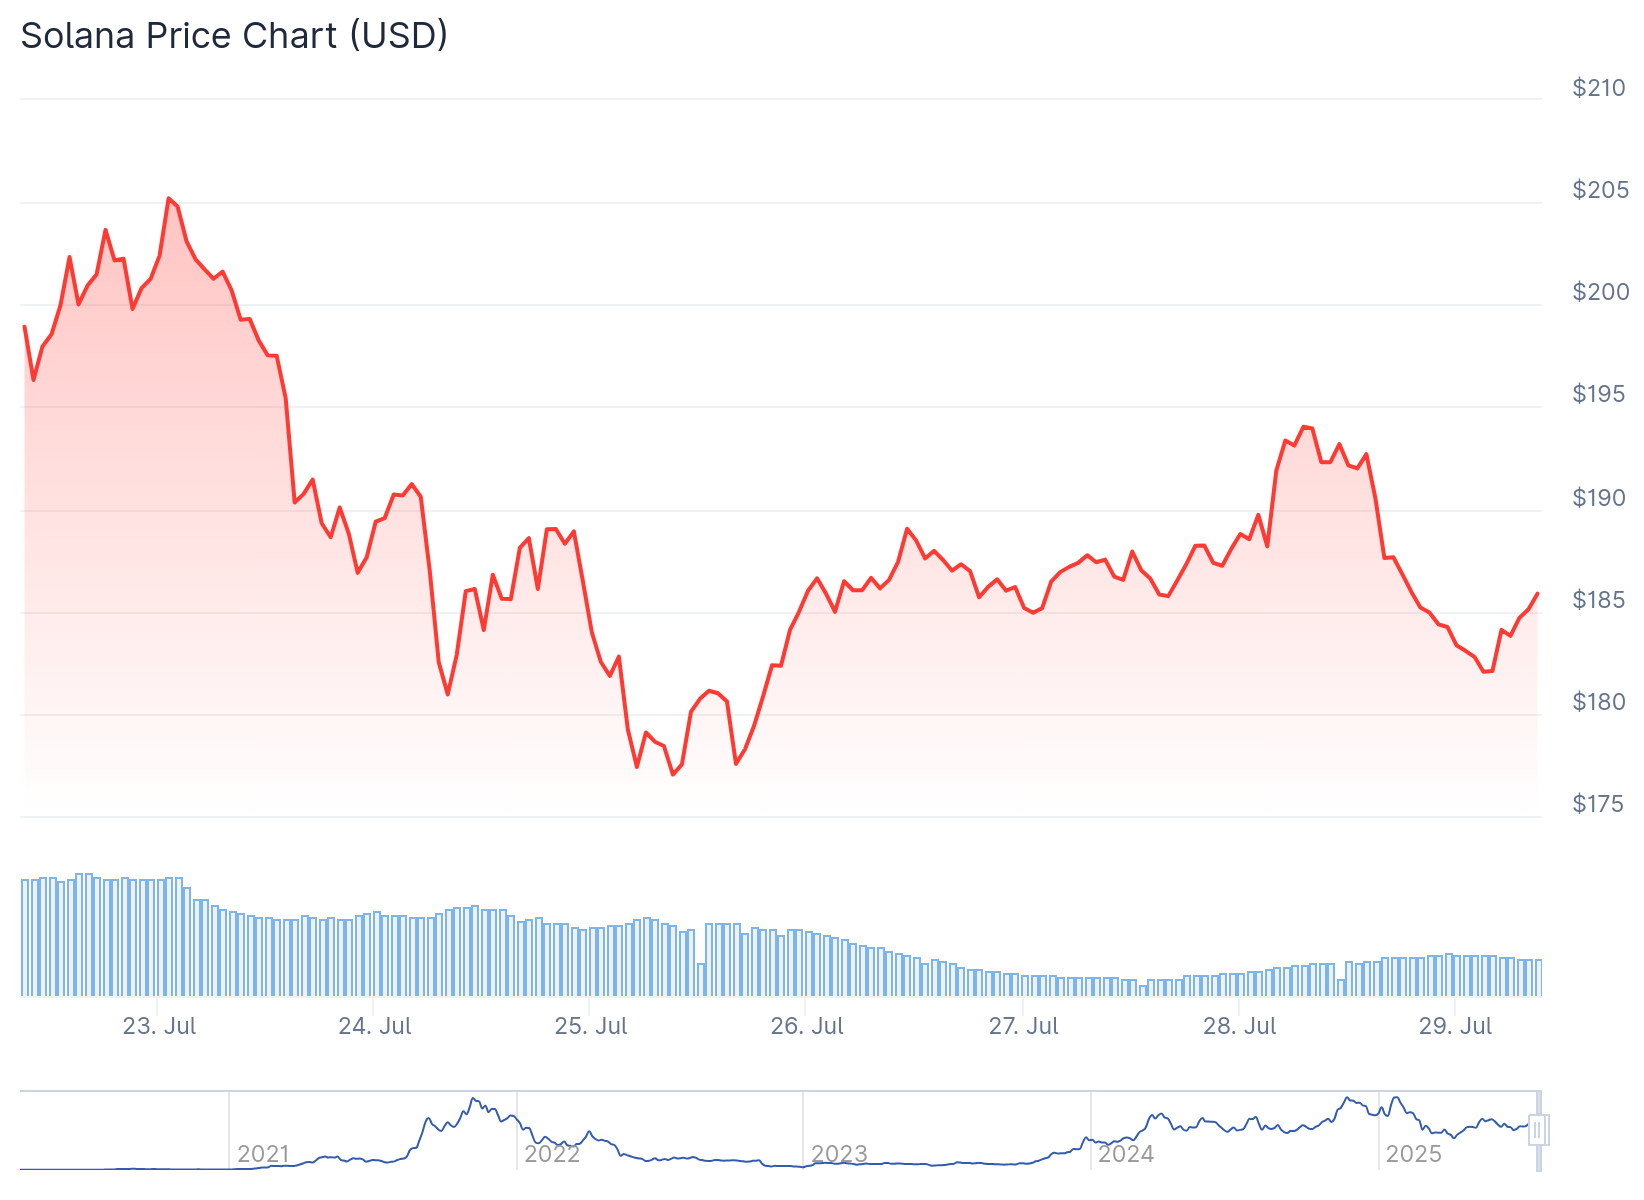
Solana (SOL) is trading near $192 after confirming a breakout from a bull flag pattern. This technical move sets the stage for a projected rally of up to 66.12%.

Analysts highlight a potential upside from $188 to nearly $295. The target aligns with previous cycle highs and key chart structures.
ChristiaanDefi’s 4-hour chart shows a strong rising trendline from late June. SOL has held higher lows consistently and just cleared local resistance zones.
$SOL || Is ready for $300✅ pic.twitter.com/MGn1yZ7tKX
— Christiaan (@ChristiaanDefi) July 26, 2025
Technical Breakout Points to $280–$300 Range
The breakout began after SOL climbed past $185, backed by strong buying volume. This move also matched a falling wedge breakout that occurred in mid-April.
$SOL/usdt DAILY
$280 gonna look so good on $SOL, the chart is FIRE 🔥🔥 pic.twitter.com/TpTC8OxOgo
— Satoshi Flipper (@SatoshiFlipper) July 26, 2025
The daily chart supports the same bullish thesis. SatoshiFlipper points out that the structure now targets $280, a level that acted as resistance during the 2021–2022 cycle.
Multiple analysts agree on the $280–$300 range as a logical extension. The breakout box drawn from base to top confirms this measured move.
MACD continues to rise, and RSI remains in bullish territory. Momentum is in the bulls’ favor, both on 4-hour and daily timeframes.
Volume, Trendline Support, and Resistance Levels
SuzzyDefi’s analysis reinforces the bullish setup. Her chart shows Solana bounced cleanly off the $187 support level.
$SOL held the trendline perfectly and bounced right off, reclaiming momentum at $187.6.
Structure is intact, and bulls are eyeing a clean breakout above $206 and a strong move past that level could trigger a fast leg higher before any short term distribution kicks in. pic.twitter.com/VSO4OqPZHr
— Suzzy | DeFi🧞♀️ (@SuzzyDefi) July 26, 2025
The price continues to form higher lows and is now aiming to break $206. A clean move above that level could start the next stage of the rally.
Solana is also trading above its 50-day, 100-day, and 200-day moving averages. This gives the trend additional credibility and shows strong market confidence.
MACD remains bullish, and increasing volume supports the trend. Historical breakouts often follow volume surges, as seen here.
Solana’s strong RSI and sustained volume suggest both retail and institutional buyers are active. The chart structure remains intact, and buyers continue to defend support.
If the price clears the $200 and $206 barriers, short-term targets include $220 and $231. Longer-term projections go even higher, with some models pointing toward $294.
Market sentiment remains bullish heading into August. SOL has outperformed most altcoins over the past two weeks, and traders are watching for continuation.
Key support sits at $180, with stronger support around $170. As long as higher lows hold, the bullish setup remains valid.
Final Thoughts
Solana price is showing strong momentum after breaking out of a clear consolidation structure. With resistance near $200 and $206 in focus, the technical setup points toward higher levels, possibly reaching $280 to $300 in the weeks ahead.


