


 Price: Bulls Eye Breakout As Token Holds Above $85 Support")


TLDR
- Solana price fell below $90 and is currently trading above $85 after failing to break the $92 resistance level
- Bulls need to push SOL above $92 to trigger another rally, with next targets at $95 and potentially $102
- A rising channel pattern shows resistance at $88, with the 100-hourly moving average providing support
- If SOL drops below $82 support, the price could decline toward $76.50 or lower to $72
- Long-term analysis suggests a potential drop to $47-$49 based on weekly chart patterns, though short-term range is $76.60 to $89.80
Solana has entered a correction phase after failing to maintain momentum above $90. The cryptocurrency is currently trading above the $85 level, supported by the 100-hourly simple moving average.
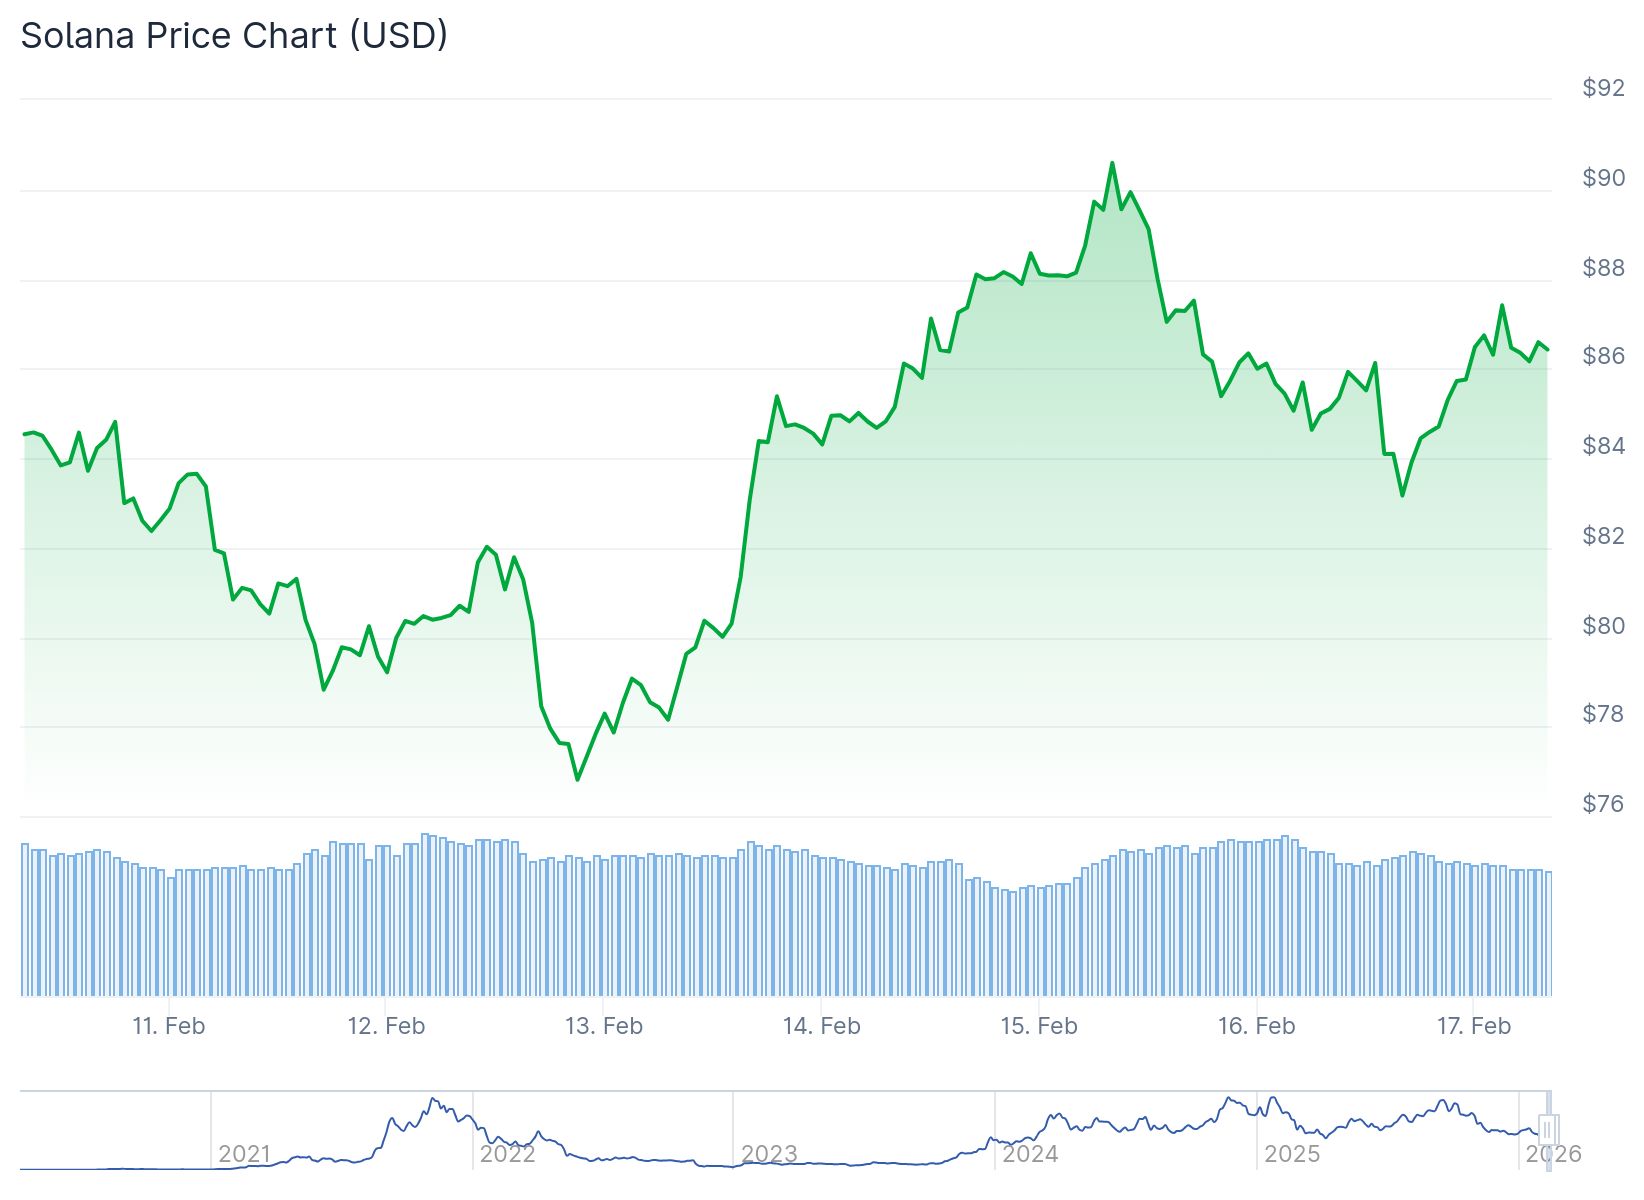
The recent price action saw SOL decline from a high of $91.20. The token dropped below both the $90 and $88 levels in quick succession. This move took the price below the 50% Fibonacci retracement level measured from the $76.54 swing low.
Bulls stepped in to defend the $82 support zone. The price has since recovered and stabilized above $85. A rising channel pattern has formed on the hourly chart with resistance sitting at $88.
The immediate challenge for Solana lies at the $88 resistance level. Beyond that, the $90 mark represents the next hurdle. The key resistance level remains at $92, which has rejected previous rally attempts.
Path to Higher Prices
A successful break above $92 could open the door to $95. Further gains might push the price toward $102. However, failure to clear the $92 barrier could trigger another downward move.
Pretty similar setup of $ETH I posted yesterday
The Solana ticker is currently forming a Adam and Eve pattern with a price target of 101$ pic.twitter.com/zRVcnBB1ir
— Moose (@Brownmoose) February 15, 2026
The first support level sits at $85. Below that, $82 represents a critical zone that aligns with the 61.8% Fibonacci retracement level. A break below $82 would likely send SOL toward $76.50.

If the $76.50 support fails, the next target on the downside would be $72. The short-term range has been identified between $76.60 and $89.80, with $83.20 acting as the midpoint.
Long-Term Technical Picture
The weekly chart shows a more bearish outlook for Solana. A head and shoulders pattern formed after the price reached $252.90. This pattern, combined with Fibonacci extension levels, points to a potential target of $47-$49.
#Solana has confirmed a breakdown from this macro Head & Shoulders pattern📉💥
Target could be as low as 50$ per $SOL. pic.twitter.com/9Zqk2BML1b
— Bitcoinsensus (@Bitcoinsensus) February 9, 2026
The weekly Directional Movement Index indicates a strong bearish trend remains in place. Moving averages on this timeframe also reflect downward momentum.
On the daily chart, several resistance zones have been identified. The $95 and $110 areas represent imbalances. The $120-$127 zone is marked as a bearish order block and another key resistance area.
Any bounce to these higher levels would likely face rejection given the longer-term downtrend. A break above $128.34, the daily swing high, would be needed to reverse the current trend.
Total Value Locked on the Solana network recently hit new all-time highs. This shows continued network confidence despite the price decline. The real-world asset market cap on Solana also surpassed $1 billion.
Banking giant Citi completed an internal proof of concept using Solana. This development shows traditional finance institutions are exploring the blockchain.
The current price action has SOL trading in a defined range over the past ten days.


