


 Price: Could This 25% Drop Be The Perfect Buying Opportunity?")
TLDR
- Solana has declined over 25% from its July peak of $206, currently trading around $162
- Key support levels identified at $160, $140-$136, and $120 with potential reaccumulation zone between $136-$148
- Short-term resistance sits at $172-$175 with major resistance at $180-$185
- Technical indicators show neutral RSI and MACD, suggesting potential for either rebound or continued selloff
- Long-term predictions place SOL between $200-$300 by end of 2025
Solana has experienced a sharp pullback from its recent highs, dropping over 25% from its July peak of $206. The Layer 1 blockchain token currently trades around $162, representing a 15% decline over the past week.
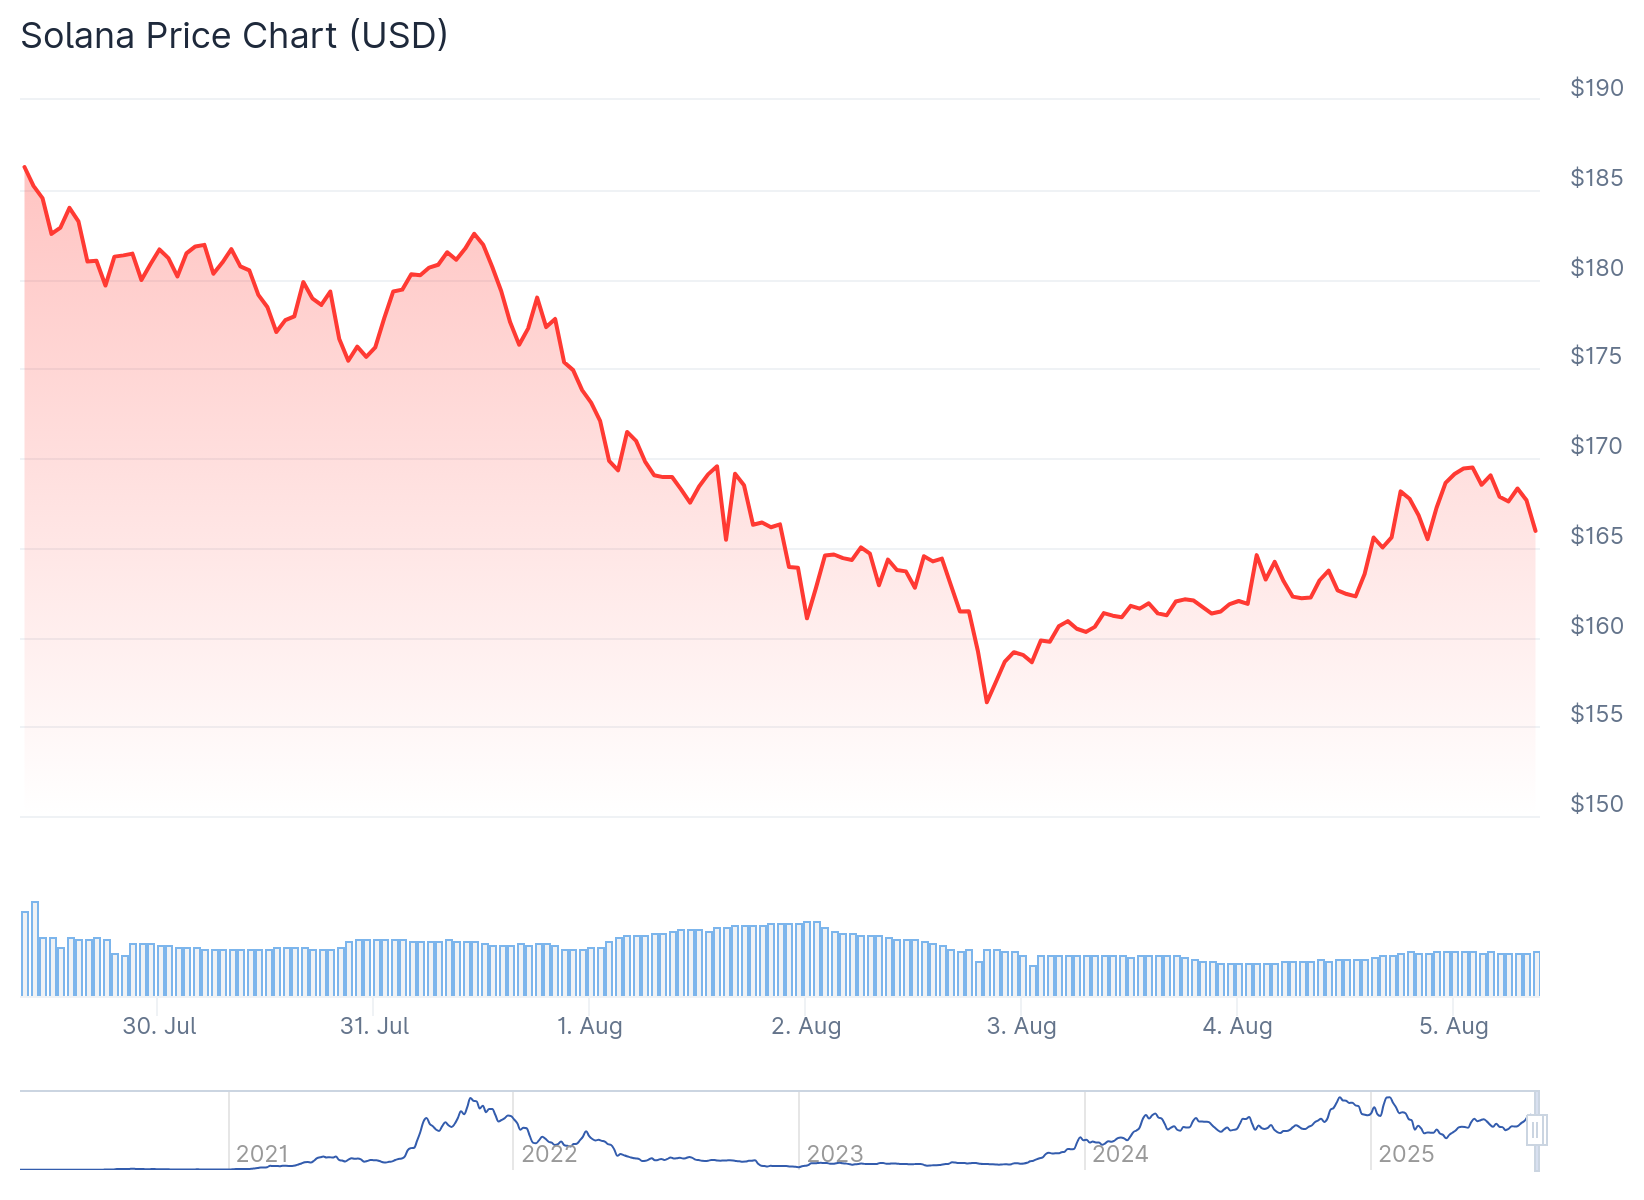
The cryptocurrency reached its local high of $206 in July 2025 following increased developer demand and institutional interest. However, profit-taking activities and broader market uncertainty have erased most of these gains.
SOL’s market capitalization now sits at approximately $90 billion. The recent decline has pushed the token back into what analysts describe as a “value zone” where long-term investors typically place their bets.
Trader Autumn Riley suggests the $136-$148 range could serve as a viable reaccumulation point. “This area historically saw strong institutional buying interest,” Riley noted, potentially indicating a buying opportunity for long-term investors.
#Solana is down over 25% from the $206 level, but this might just be the setup smart money waits for.
It’s now entering a high-interest area: $136–$148.
Patience here could pay off big. pic.twitter.com/cEC0RTgOKp
— Autumn Riley (@Autumn_Rileyy) August 3, 2025
Combined models from Perplexity AI indicate SOL could settle into the $162-$165 range for most of August. A near-term rally toward $172-$175 may develop if trading volume increases and market sentiment improves.
The token faces immediate resistance at $180-$185. Breaking through this level would require positive catalysts such as favorable macroeconomic data or increased decentralized application usage.

Technical Analysis Shows Mixed Signals
Current technical indicators paint a neutral picture for Solana. The RSI and MACD indicators remain in neutral territories, suggesting the token could move in either direction depending on external factors.
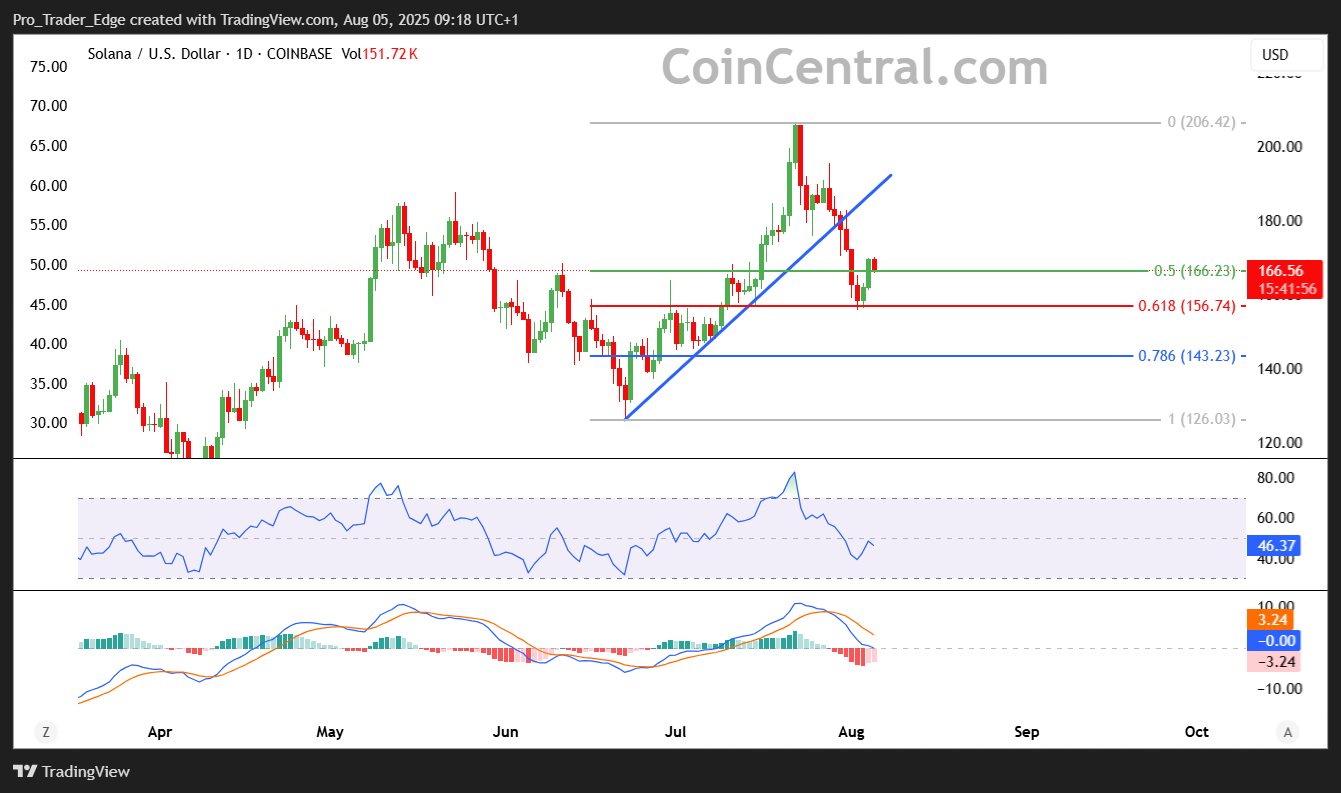
Key support levels have been identified at $160, $140-$136, and $120. If bearish momentum continues and SOL fails to hold the $160 support, analysts expect a drop to $140.
Riley believes smart money accumulation could occur at the $140 level. A further decline to $136 might extend the pullback to $120, which is considered a strong support zone.
Recovery Potential Emerges
Recent price action suggests Solana may be positioning for an upward move. The token has found support near the $155 zone and climbed above the $160 level.
SOL has broken above the $162 resistance and currently trades above the 100-hourly simple moving average. A bullish trend line has formed with support at $165.
The price faces immediate resistance near the $170 level, close to the 50% Fibonacci retracement level. The next major resistance sits at $172, followed by $180.
A successful break above $180 could set the stage for another steady increase. The next key resistance level is $182, with potential gains toward $192.
Despite near-term volatility, Solana’s long-term fundamentals remain strong. Network growth, developer engagement, and institutional flows continue to support the ecosystem.
Experts believe SOL could revisit the $200-$300 range later in 2025. Some optimistic predictions place the token above $500, though this depends on favorable market conditions and broader cryptocurrency adoption.
Current hourly MACD indicators show gaining pace in the bullish zone. The hourly RSI sits above the 50 level, indicating potential upward momentum.
Major support levels remain at $165 and $162, while major resistance levels are positioned at $172 and $182.


