


 Price: Exchange Balances Drop 10% as Golden Crossover Signals Bullish Move")


TLDR
- Solana exchange balances dropped 10% indicating reduced selling pressure and potential price recovery
- CME institutional futures remain steady while spot price declined, creating bullish divergence pattern
- Golden crossover setup forming on daily chart with 100-day EMA approaching 200-day EMA crossover
- Fractal pattern analysis suggests SOL could rally 118% to reach $340 target price
- Over $200 million bridged to Solana network from other chains, showing growing DeFi demand
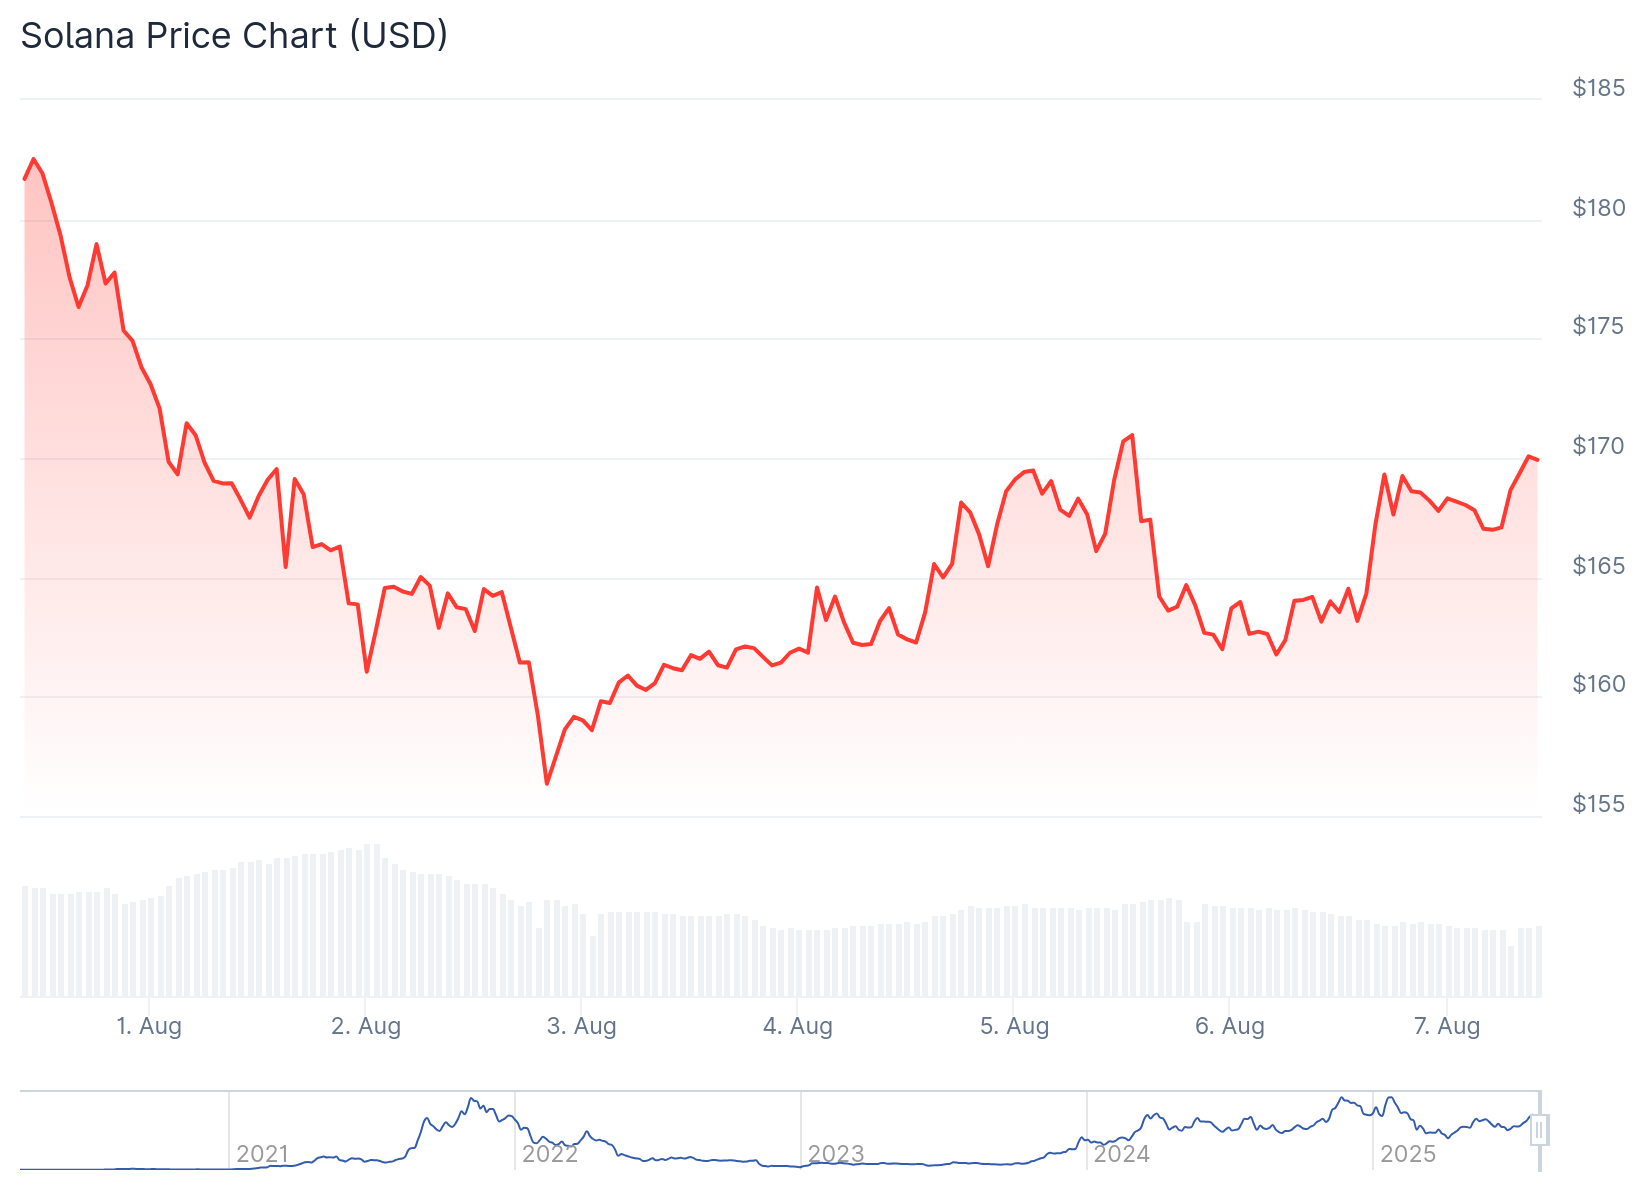
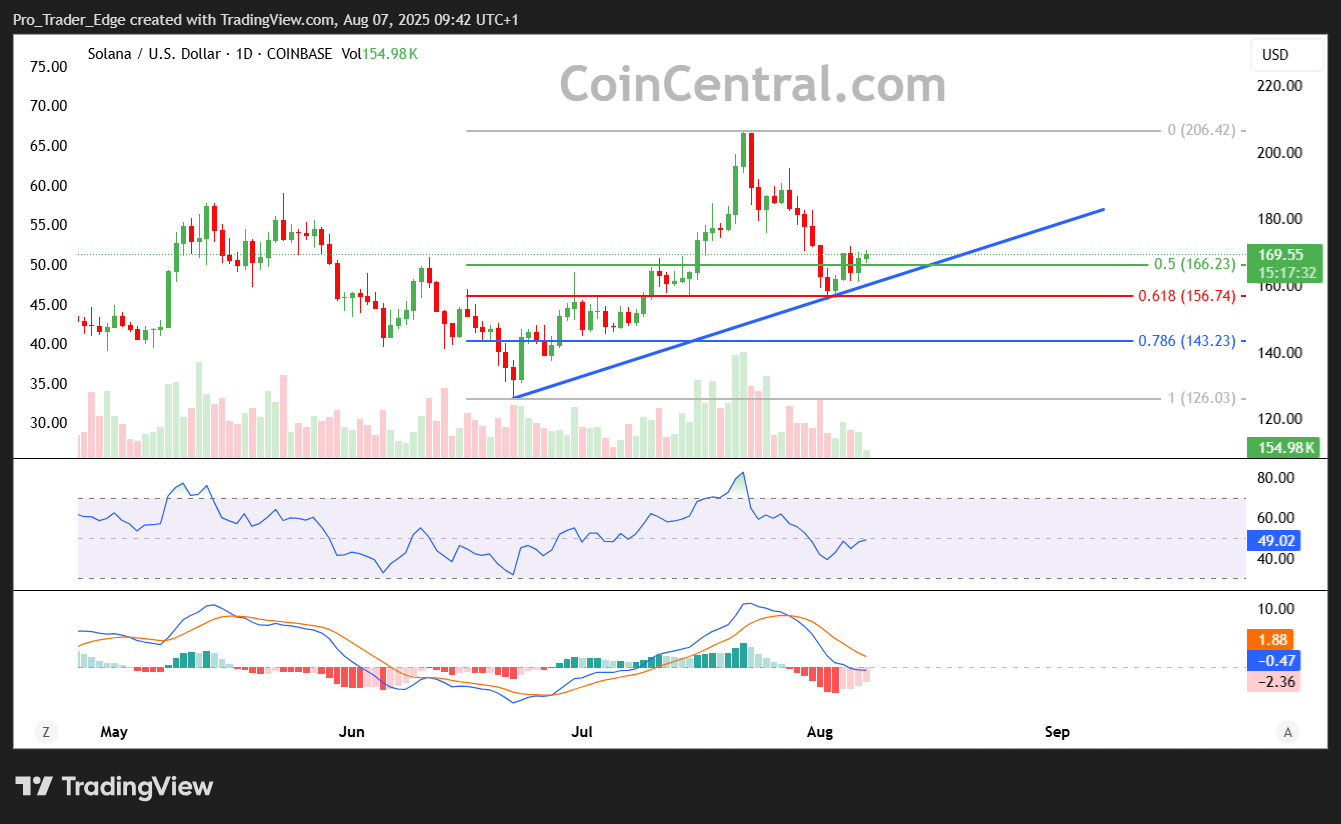
Solana price has dropped nearly 10% over the past seven days, bringing the altcoin down from its recent highs near $200. The cryptocurrency currently trades around $168, but several key metrics suggest a recovery may be developing.
Exchange data shows Solana balances have fallen from 33.06 million tokens on July 23 to 30.78 million SOL on August 5. This represents a 10% decrease in tokens held on centralized exchanges.
Lower exchange balances typically indicate reduced selling pressure. When fewer tokens sit on exchanges, it often signals that holders are moving their assets to cold storage rather than preparing to sell.
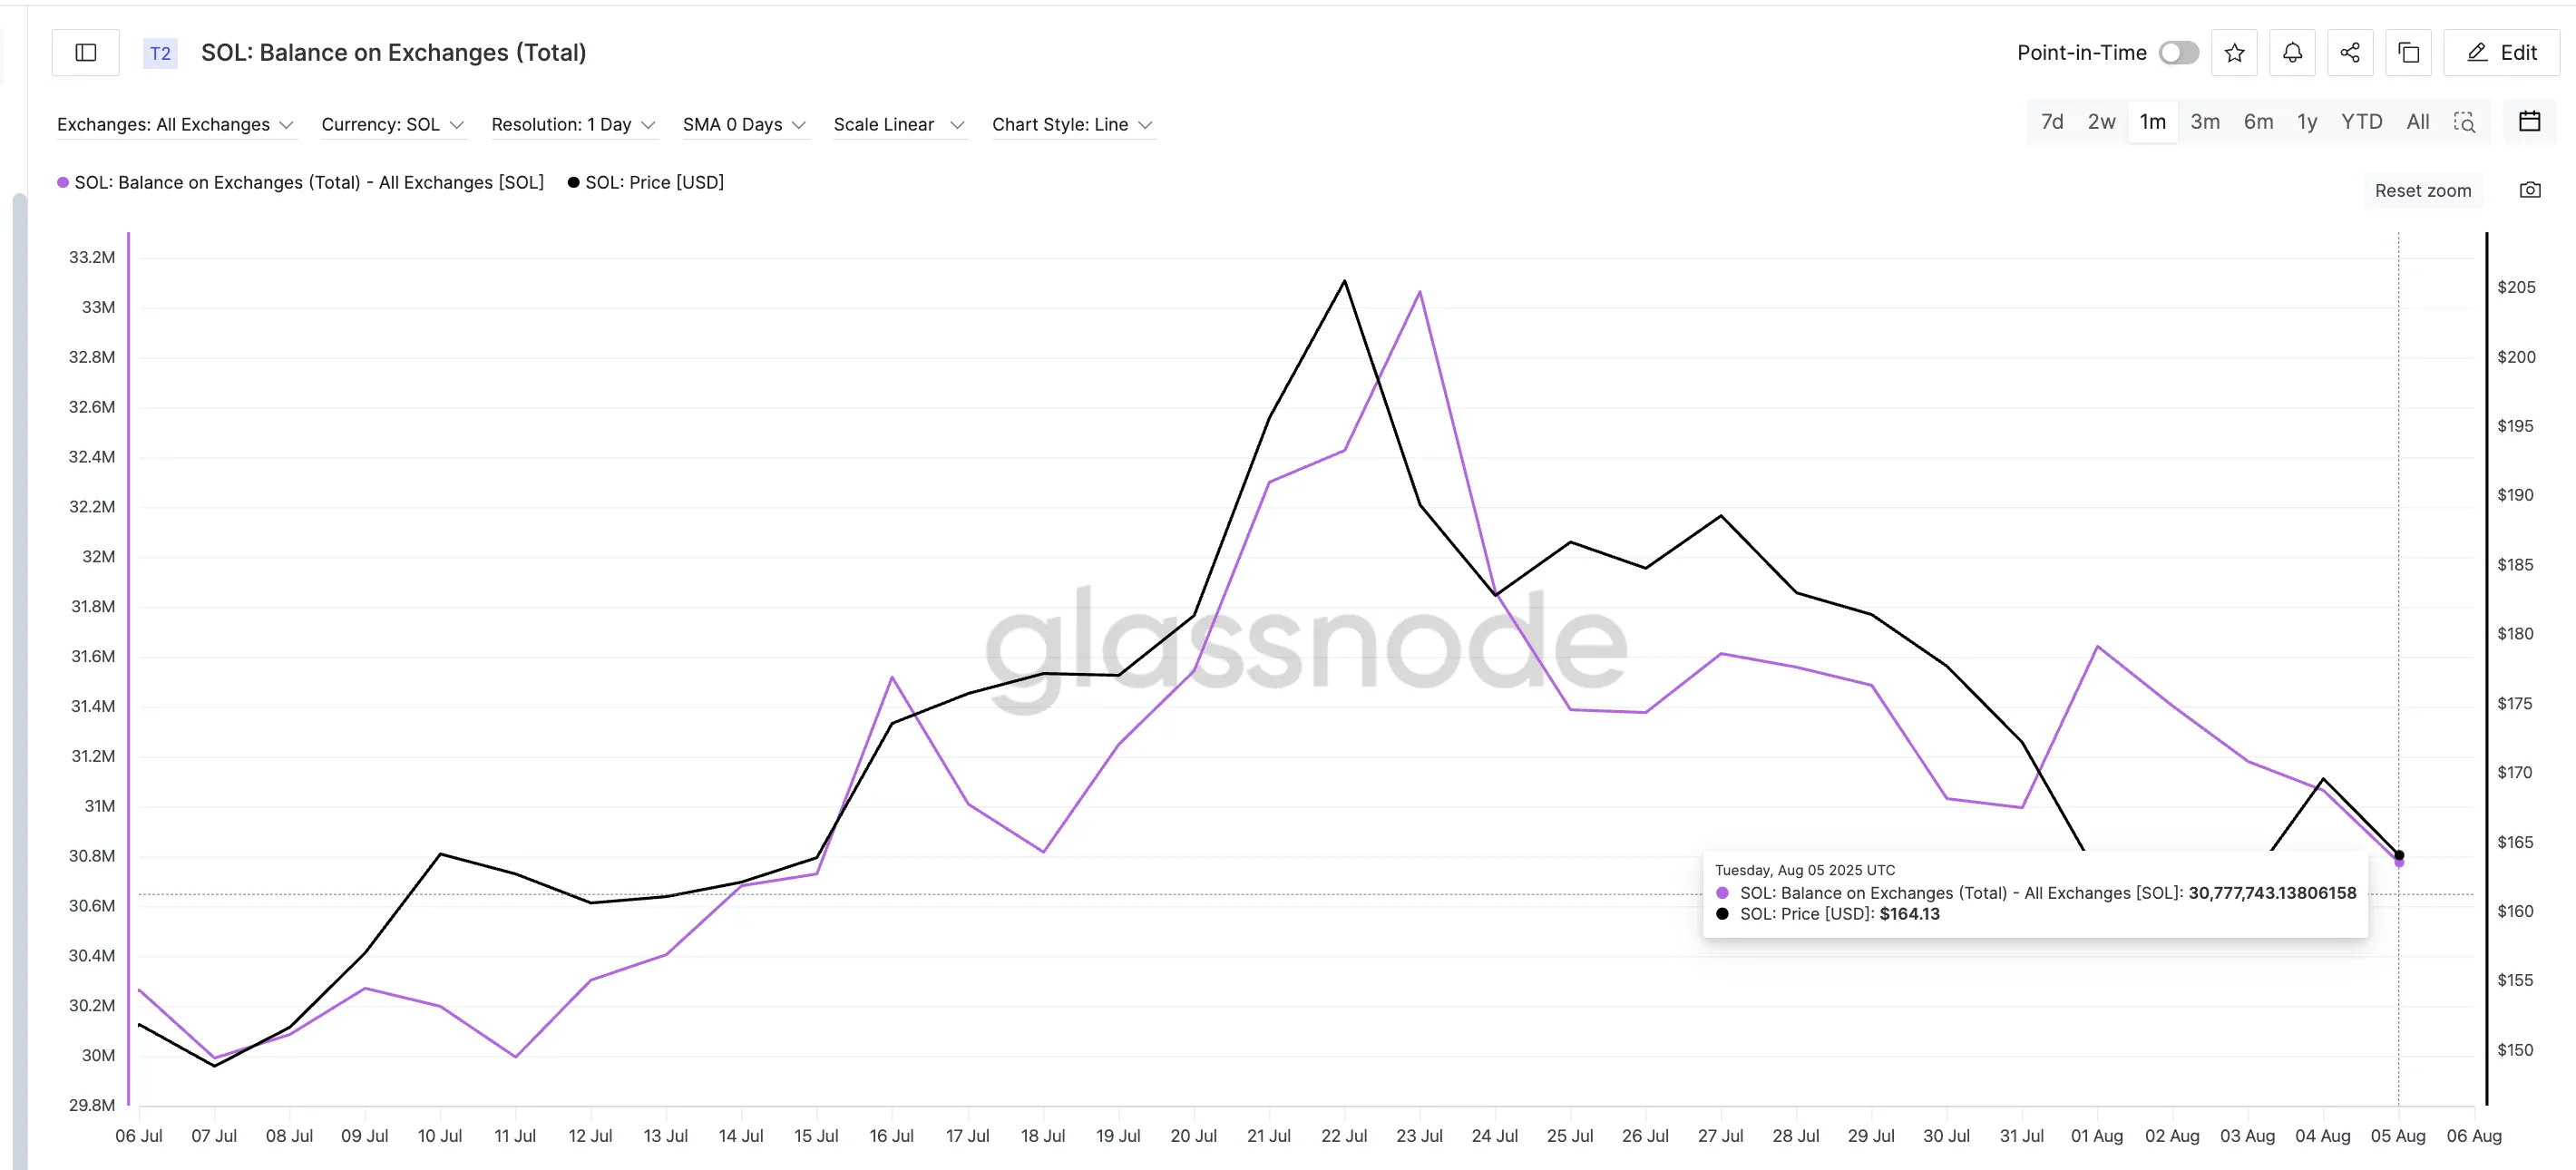
The price has also crossed above the exchange supply trendline. This bullish crossover has historically preceded short-term rallies for SOL.
On July 16, when Solana’s price moved above this supply line, Solana price jumped from $173 to $205 in six days. A similar pattern occurred on July 24, where the price rose from $182 to $188 in three trading sessions.
Institutional Futures Show Strength
CME futures open interest has remained stable despite the spot price decline. This creates what analysts call a bullish divergence pattern.
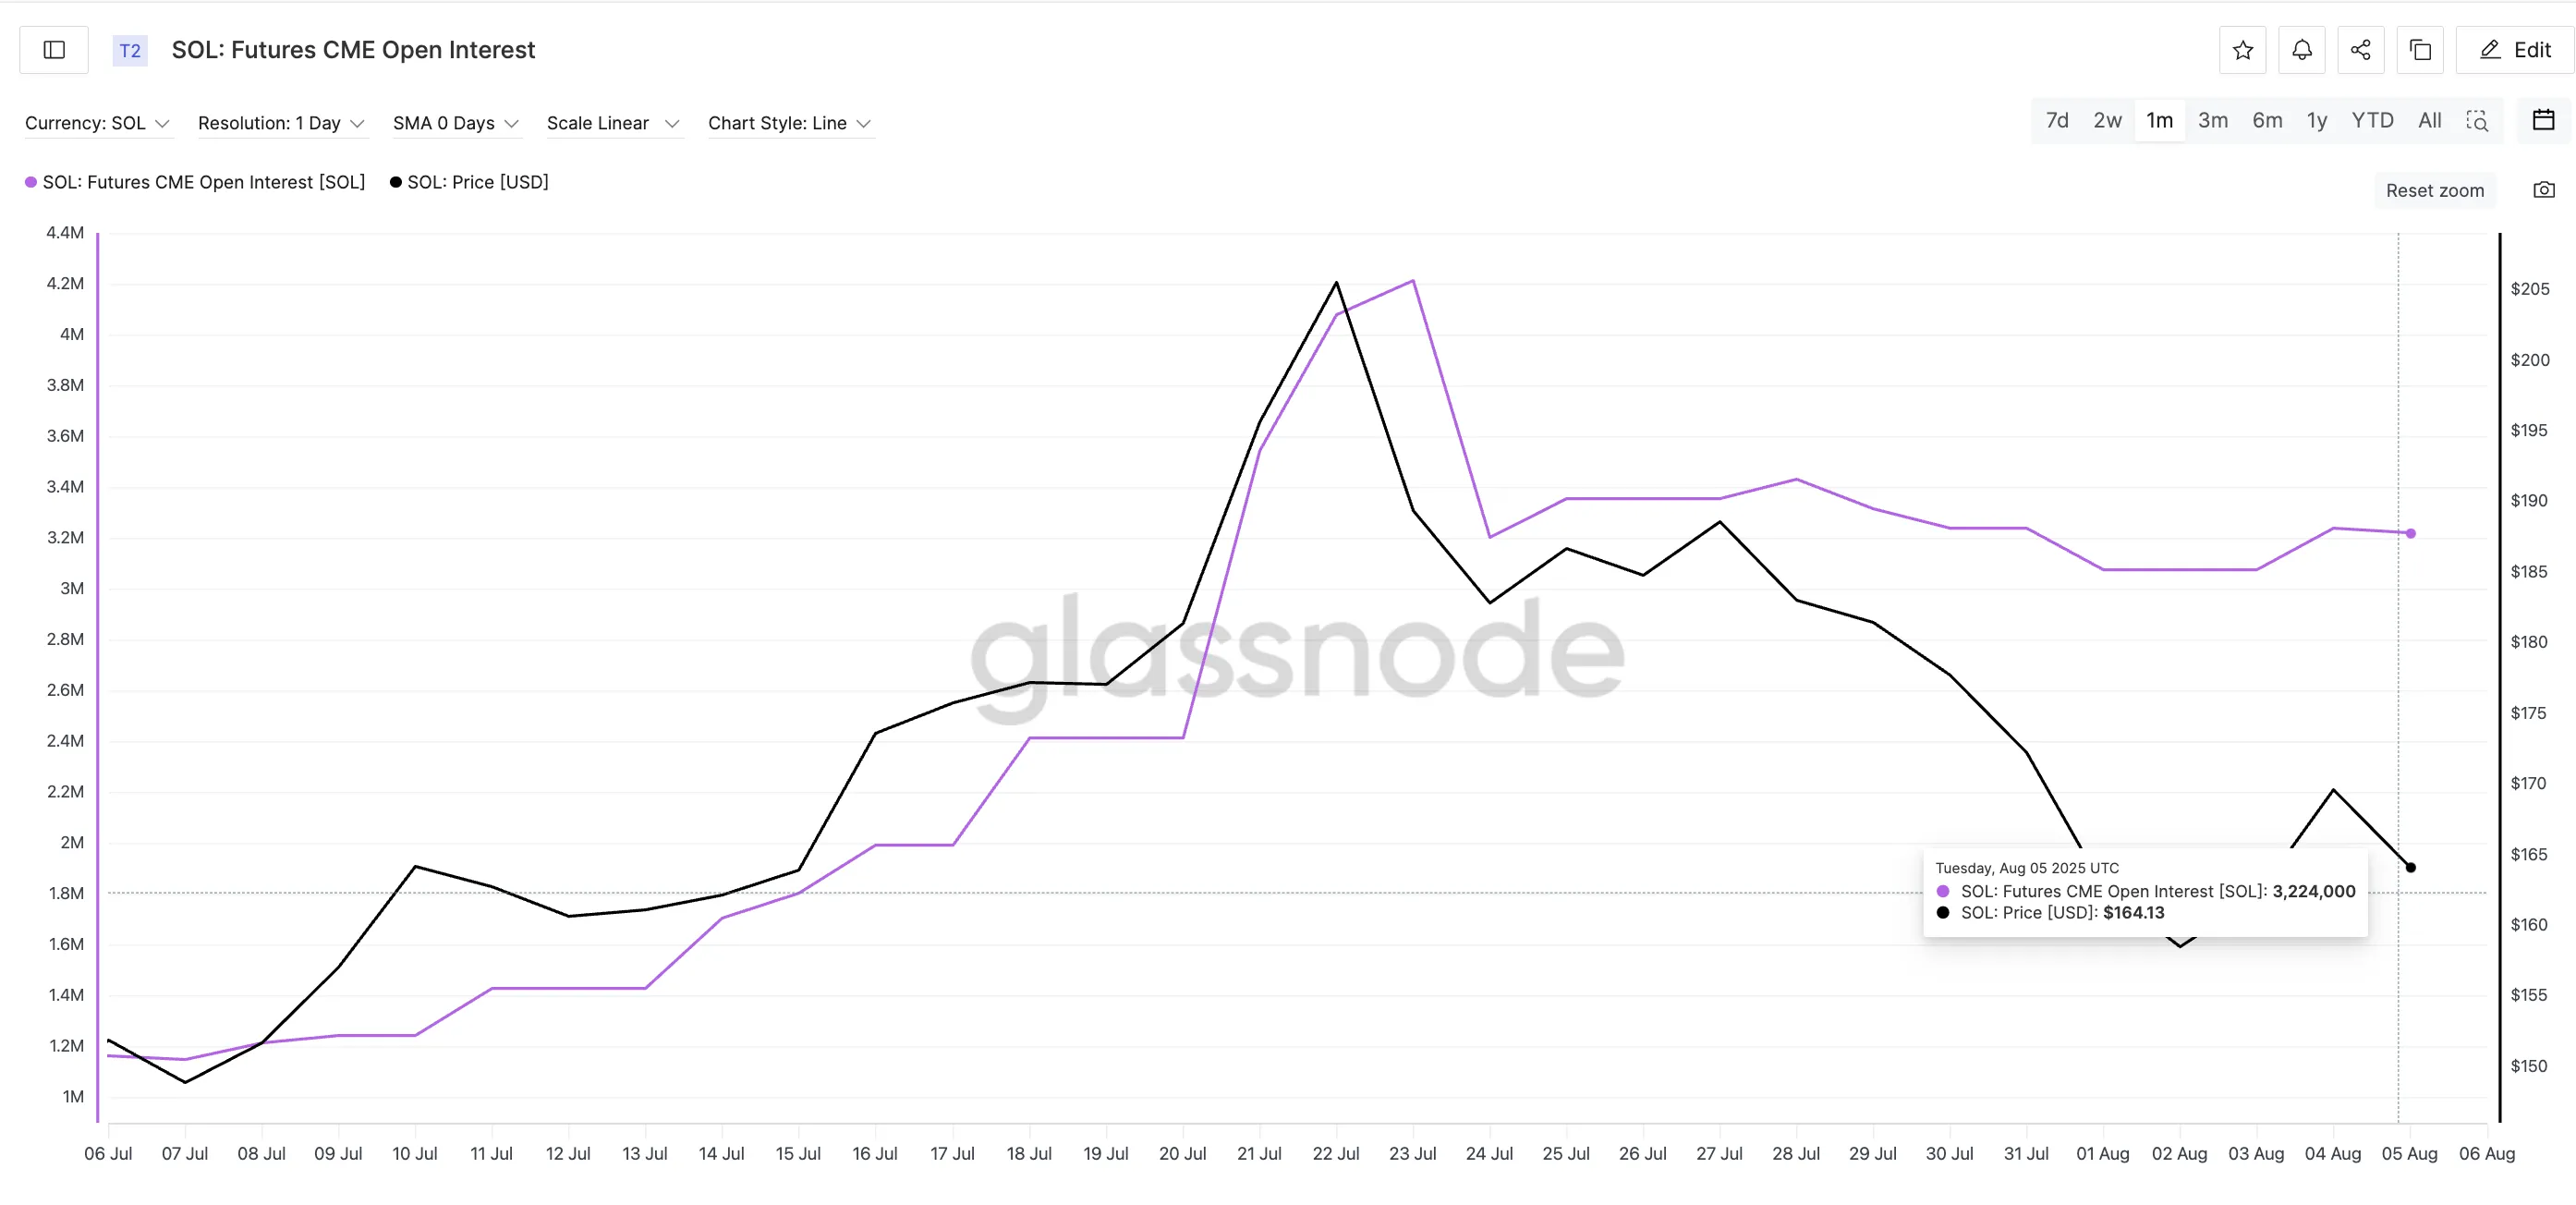
On August 1, CME open interest held at 3.07 million while SOL’s price fell from $162 to $158. The token then bounced back to $169 once the divergence narrowed.

A similar pattern played out between July 25 and 27. CME open interest stayed flat while price dropped, only for Solana to recover from $184 to $188 once sentiment stabilized.
CME futures represent institutional trading activity. Steady futures interest during price declines often suggests long-term buyers are holding positions while waiting for weaker hands to exit.
The technical chart shows a potential golden crossover setup forming. The 100-day Exponential Moving Average is approaching the 200-day EMA from below.
If confirmed, this golden cross pattern typically signals the start of an upward trend. SOL currently holds above $160 support levels.
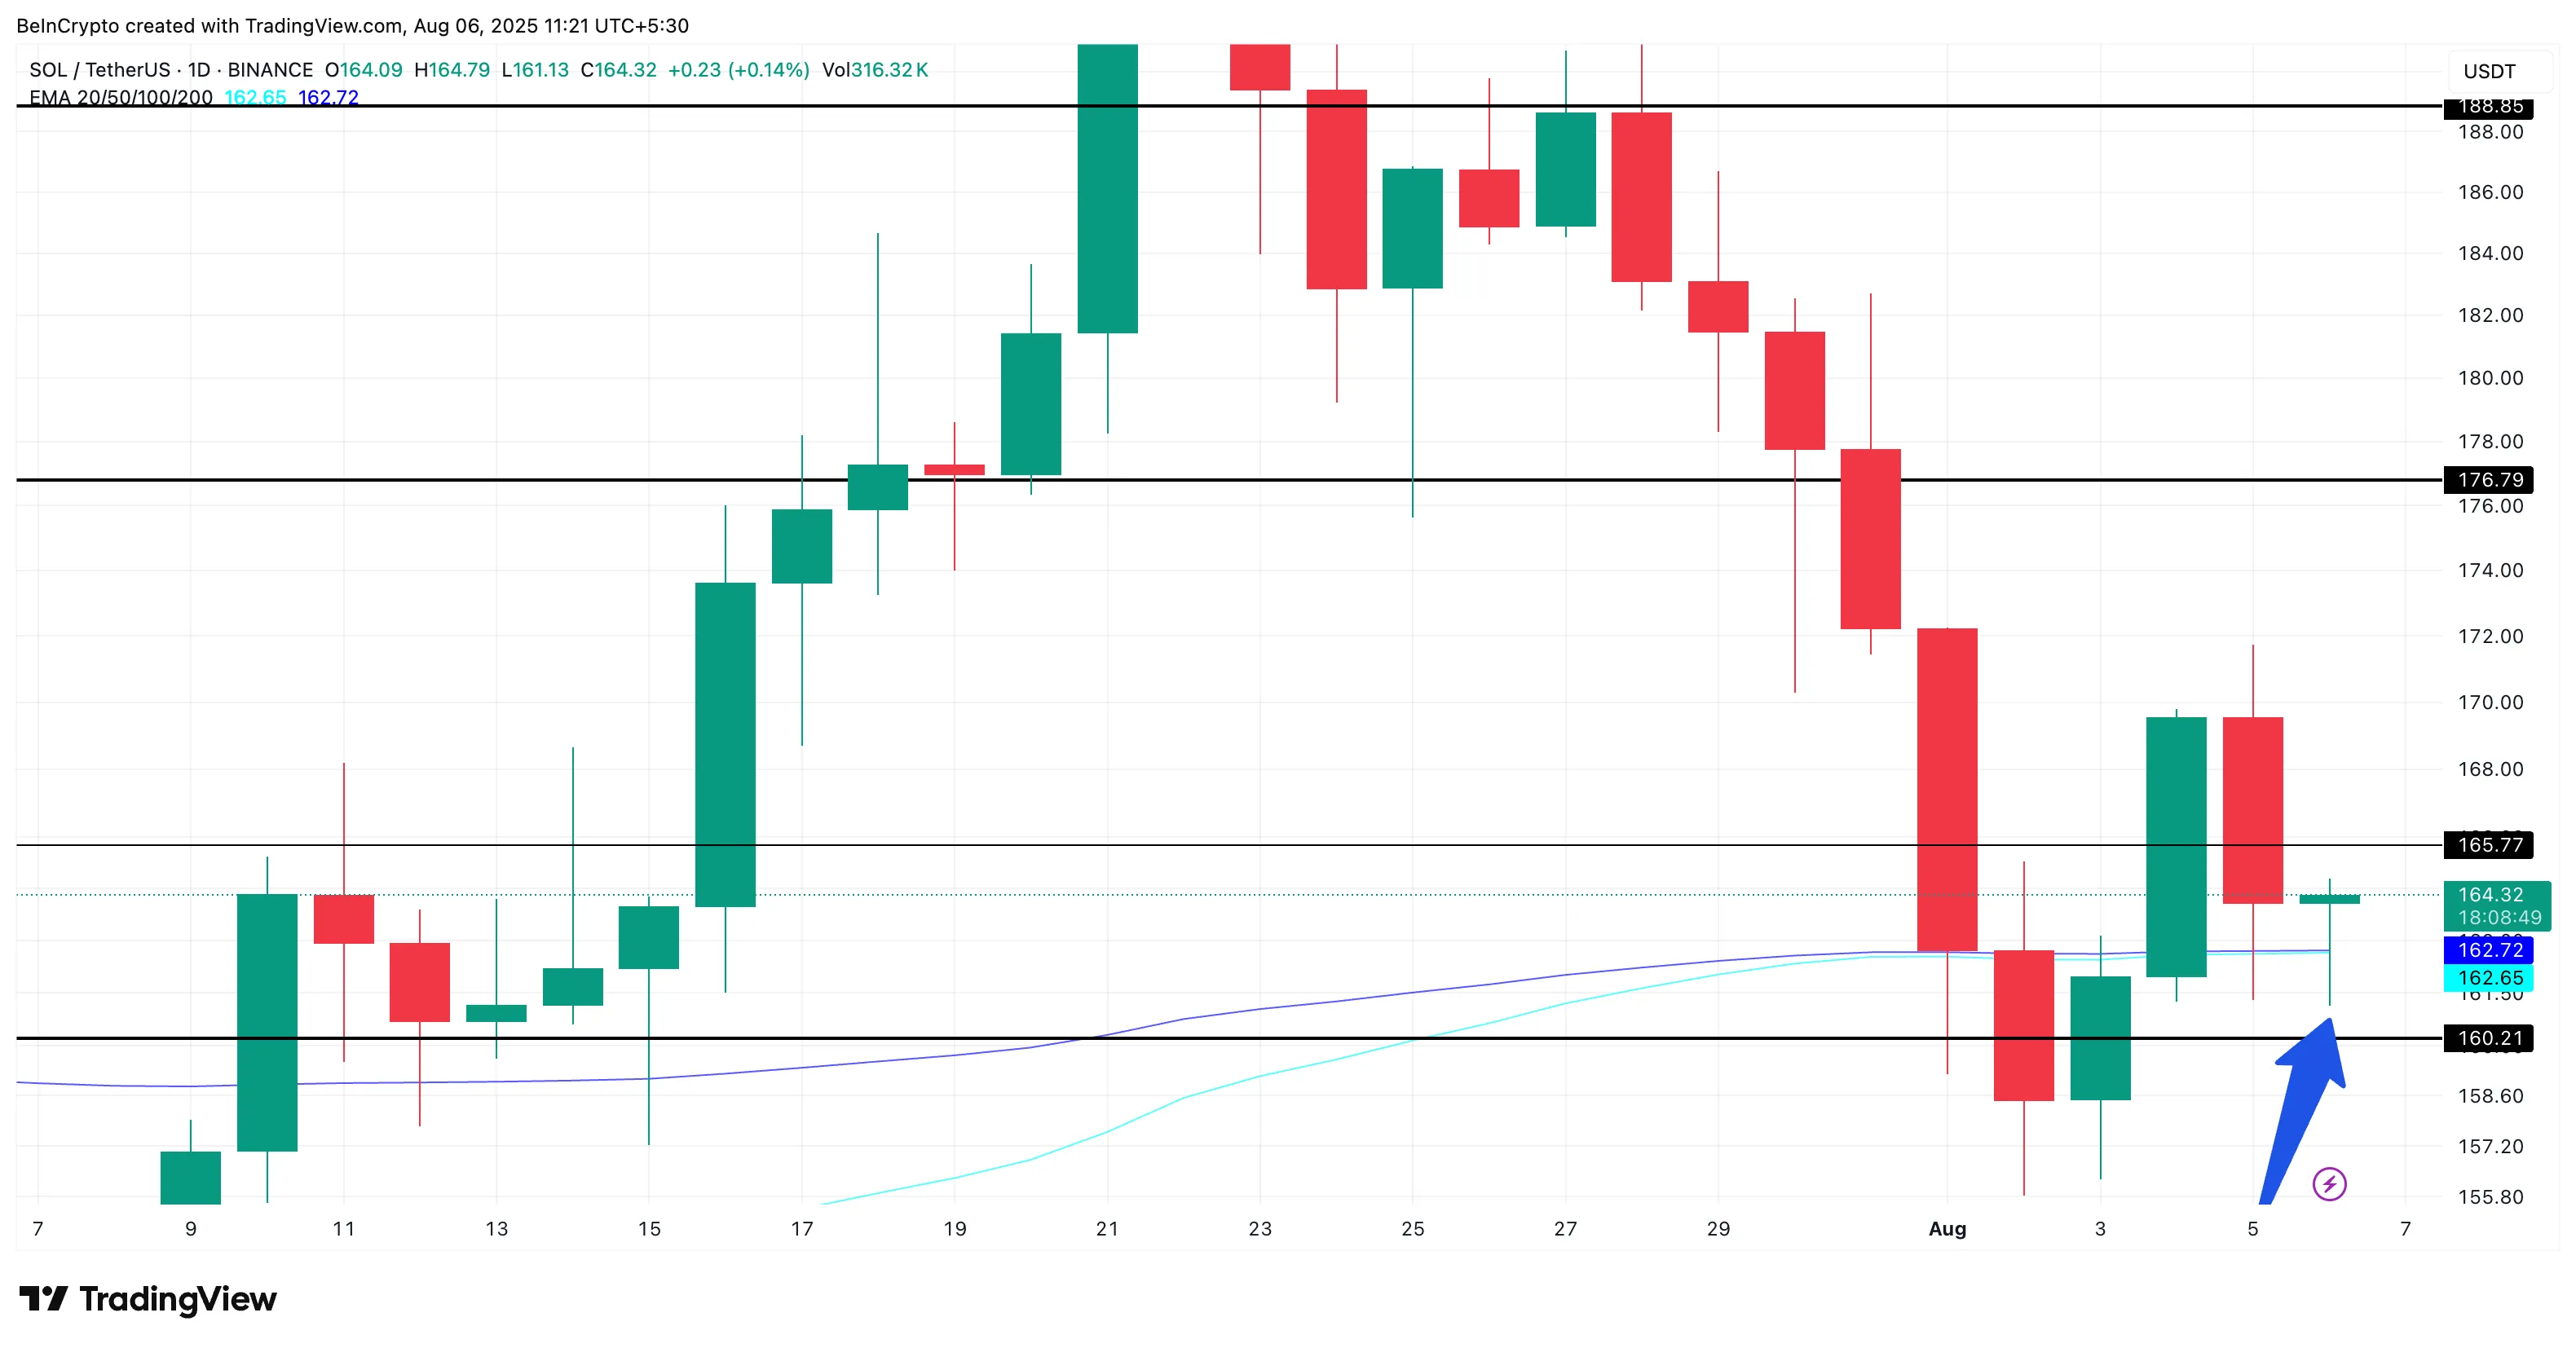
A move to reclaim $176 would represent a 10% gain from current levels. This could flip the short-term trend bullish for the cryptocurrency.
Fractal Pattern Suggests Larger Rally
Market analysts have identified a fractal pattern similar to one that preceded a 70% rally in 2024. The current setup mirrors price action from the last quarter of 2024.
If history repeats, SOL could target $340, representing a 118% increase from current levels. The previous fractal pushed SOL from $155 to $265 during last year’s rally.
Technical analysis shows support building at the $164 level. Buyers are targeting resistance levels at $177 and $189 to flip them into support zones.
The MACD histogram displays positive green bars, suggesting rising bullish momentum. However, SOL must clear resistance at $177 and $189 to confirm a trend reversal.
Users have bridged over $200 million to the Solana network from other blockchains. Ethereum contributed $113
million of this total, while Arbitrum and Base added $37.73 million and $24.86 million respectively.
This bridging activity indicates growing demand for Solana-based decentralized finance applications. Spot net outflow reached $17.21 million on August 6, aligning with broader exchange reserve flows.
Whale activity has increased with one large investor acquiring 71,000 SOL worth approximately $12 million. Such accumulation patterns often precede price recoveries.
Phantom wallet has acquired Solsniper to expand its analytics capabilities. This acquisition brings token analytics and wallet tracking features to the popular Solana wallet.
SOL maintains support above $160 while resistance levels sit at $177, $189, and $200 respectively.


