


 Price: Institutions Buy as Token Tests $80 Support Level")


TLDR
- Solana price hovers above $80 after dropping over 4% on Tuesday, struggling to recover from recent losses.
- Stablecoin supply on Solana grew 14% in the past seven days to $15.34 billion, indicating users are holding capital on-chain despite risk-off sentiment.
- SOL futures Open Interest dropped 2.74% to $5.08 billion, with long liquidations totaling $6.09 million compared to $2.01 million in short liquidations.
- US spot SOL ETFs recorded $8.43 million in inflows on Tuesday, showing continued institutional demand at lower price levels.
- Technical indicators show Solana trading below key moving averages at $116 and $148, with immediate support at $80 and resistance at $85.
Solana trades at $82 on Wednesday after losing more than 4% on Tuesday. The layer-1 blockchain faces pressure as it tries to maintain support above the $80 level.
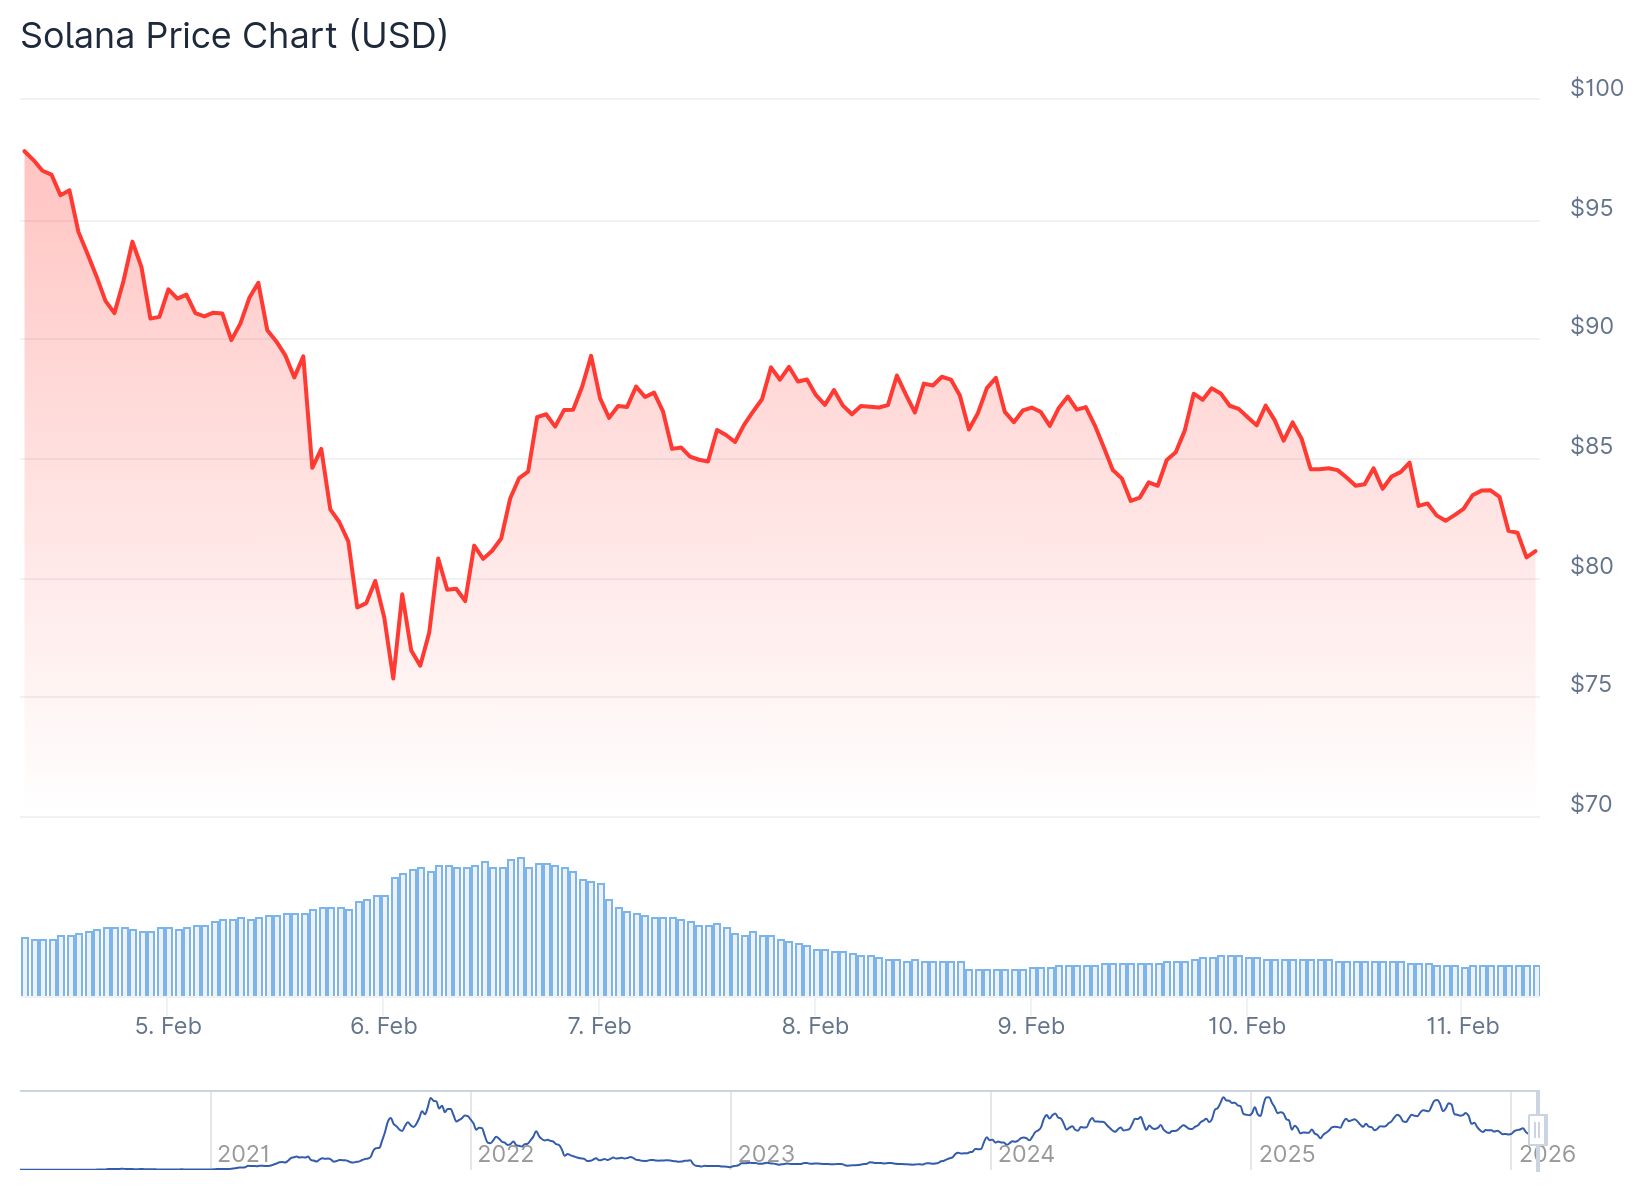
The price dropped below $85 and now trades beneath the 100-hour simple moving average. A key bearish trend line has formed with resistance at $85 on the hourly chart.
Despite the price weakness, on-chain data shows mixed signals for Solana’s market structure. Stablecoin supply on the network increased roughly 14% over the past week.
📊 Are traders still showing extreme fear after Bitcoin recovered from its $60.0K drop last week? According to social data, there is still a very high level of bearish posts compared to bullish.
🤔 With the crowd remaining pessimistic, the numbers suggest that retail is afraid… pic.twitter.com/vC2ZpXiR9R
— Santiment (@santimentfeed) February 10, 2026
The total stablecoin supply reached $15.34 billion according to DeFiLlama data. Traders appear to be swapping volatile tokens for stablecoins while keeping capital on the Solana blockchain.
Derivatives Data Shows Bearish Pressure
Futures market data reveals declining interest among traders. SOL futures Open Interest decreased 2.74% in the last 24 hours to $5.08 billion.
Long liquidations totaled $6.09 million during this period. Short liquidations came in at $2.01 million, showing a bearish bias among traders.

The funding rate stands at -0.0061%, confirming increased short-side interest. Traders are paying a premium to hold bearish positions on Solana.
Institutional Investors Continue Buying
US spot SOL ETFs recorded $8.43 million in inflows on Tuesday. This marks continued institutional demand despite the recent price decline.
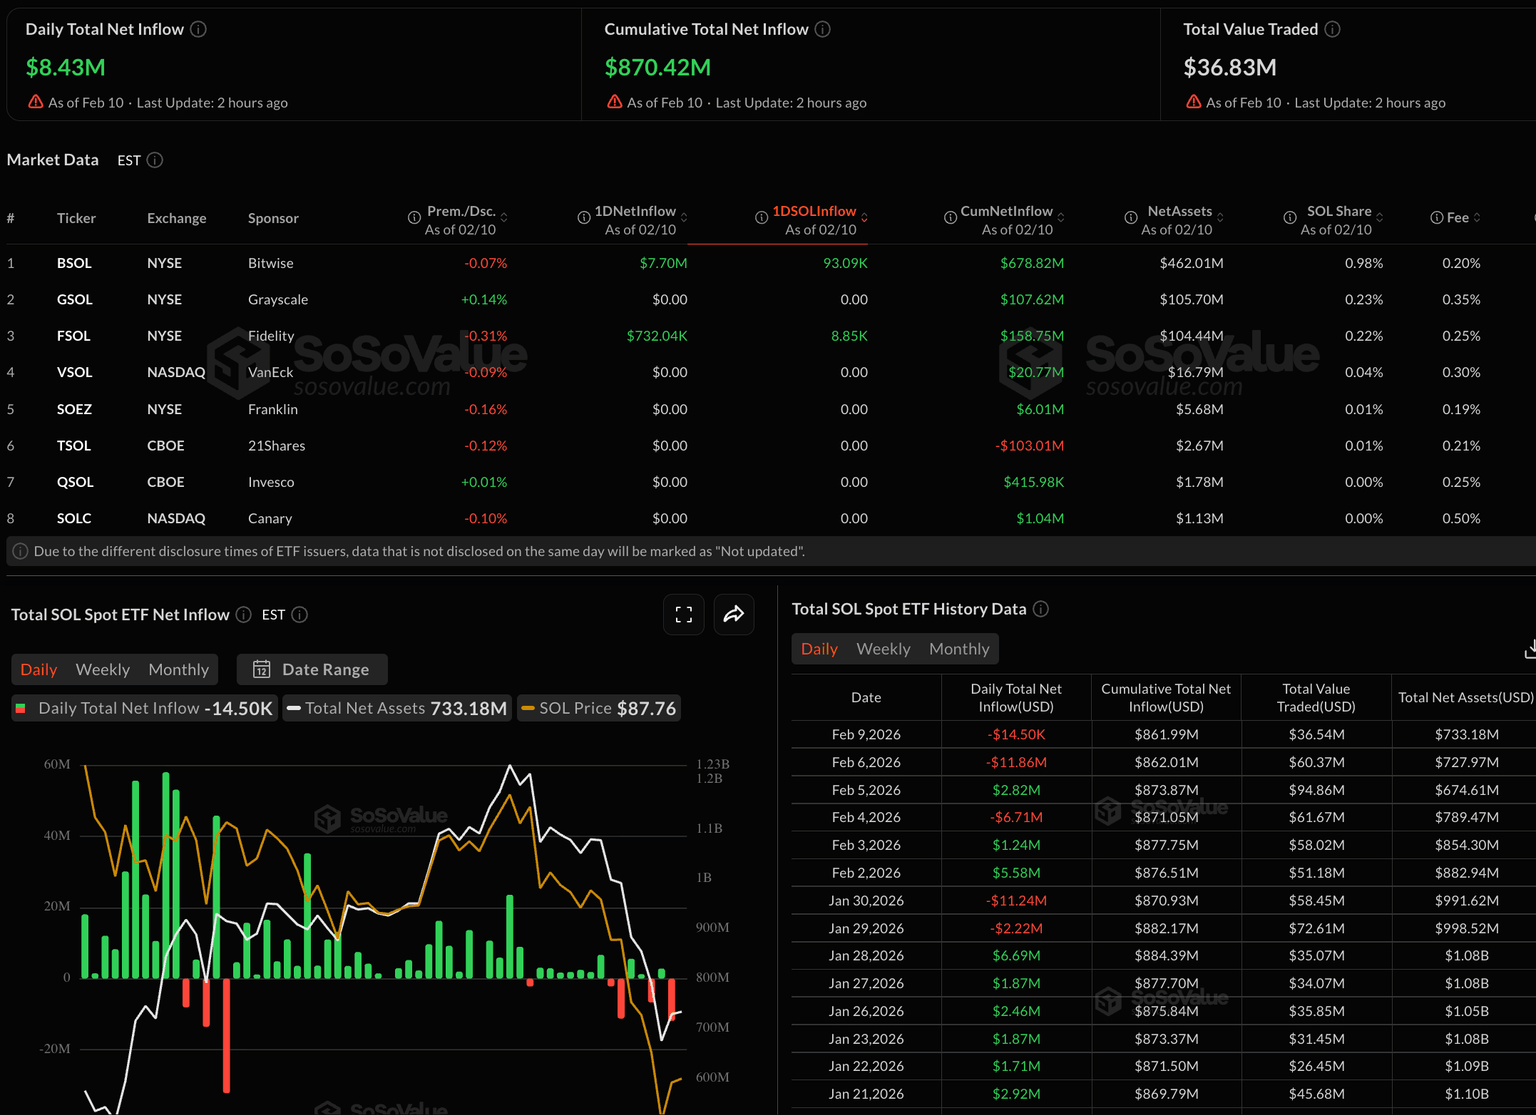
Steady inflows at lower price levels could help Solana establish a bottom. Institutional buying may support a trend reversal if it continues.
The Relative Strength Index sits at 27 on the daily chart. This indicates oversold conditions and hints at a potential rebound.
The Moving Average Convergence Divergence shows contracting negative momentum. The bearish pressure appears to be fading based on this indicator.
Key Price Levels to Watch
Solana trades below the 50-day Exponential Moving Average at $116. The 200-day EMA sits at $148, both sloping lower and confirming bearish structure.
🐋 WHALE WATCH: $SOL levels are set.
=> Support 1: Healthy correction.
=> Support 2: Maximum pain / Maximum opportunity.
The bounce is inevitable. The only question is how much you’re willing to stack before the recovery begins.
Tick tock. pic.twitter.com/nETE2nknnG
— Whale Factor (@WhaleFactor) February 10, 2026
Immediate resistance appears at $85 where the bearish trend line sits. The next resistance levels are at $92 and $96.
A break above $96 could open the path toward $105 and $112. However, Solana must first clear the $85 resistance to gain upward momentum.
Support sits at $80 based on Fibonacci retracement levels. A break below this level could push the price toward $75.
Further downside could target $70 if the $75 support fails. The 61.8% Fibonacci extension level at $64 represents a deeper support zone.
Solana attempted recovery above $78 and $82 earlier this week. The price climbed above the 50% Fibonacci retracement level but failed to hold gains near $90.


