


 Price: Key Support and Resistance Levels Traders Are Watching in April")


TLDR
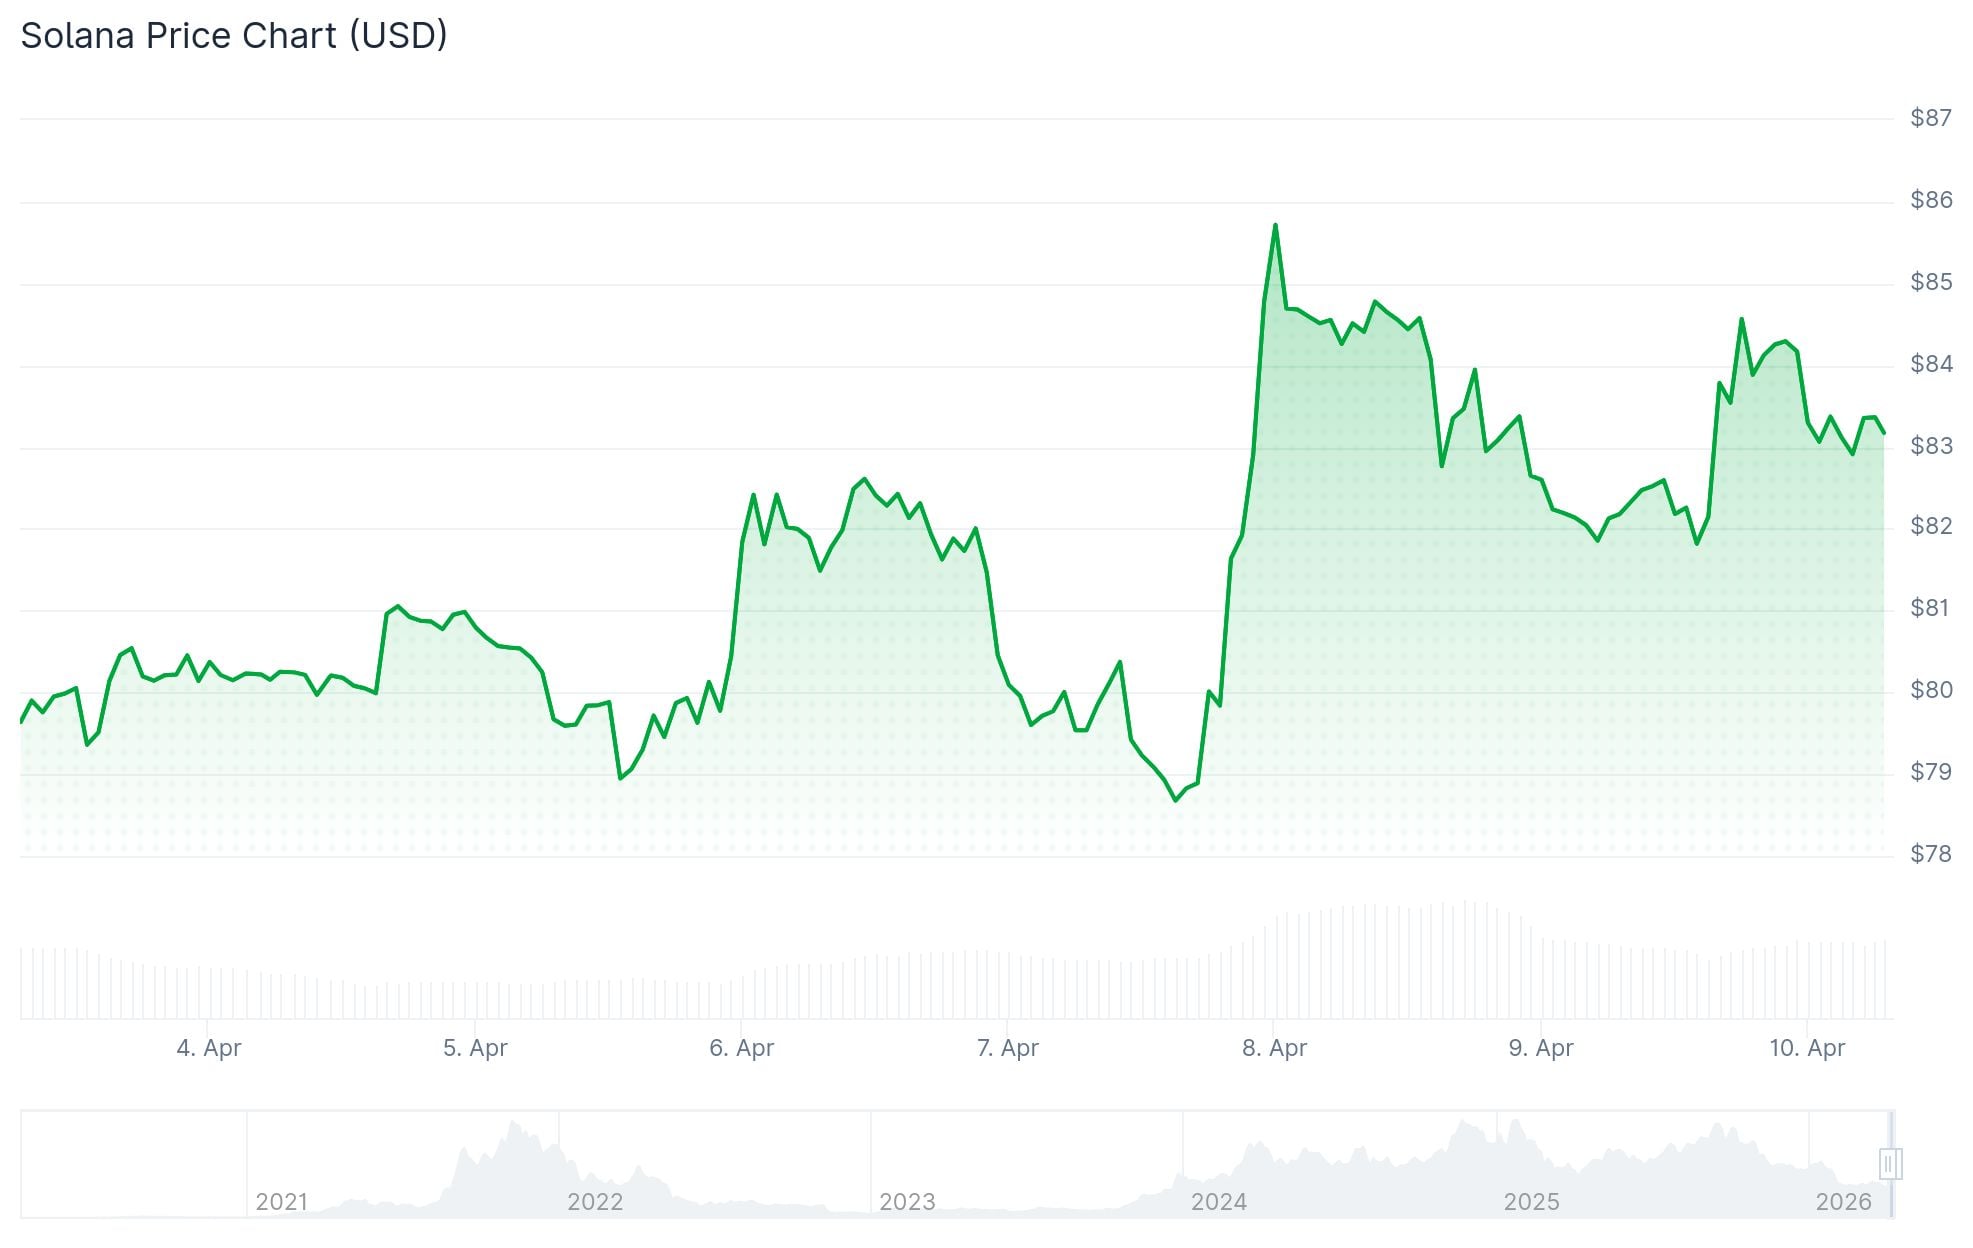
- SOL is trading around $83, stuck below a descending trendline and key moving averages
- Solana ETFs have seen $17.08 million in outflows this week, including a record $15.40 million single-day outflow on Tuesday
- Total liquidations over 24 hours hit $7.99 million, mostly short positions
- The 50-day EMA at around $87–$88 is the key resistance level to watch
- Analyst Ali Martinez flagged a repeated pattern of SOL briefly reclaiming the 50-day MA before selling off again
Solana is trading around $83 on Friday, April 10, holding above the $80 support level but struggling to push higher. The price sits below its 50-day, 100-day, and 200-day Exponential Moving Averages (EMAs), keeping the short-term outlook mixed.
A descending trendline connecting the January 14 and April 7 highs is acting as overhead resistance, converging near the 50-day EMA at around $87 to $88. SOL has not been able to close above this zone.
The Relative Strength Index (RSI) sits at 47, pointing to weak momentum. The Moving Average Convergence Divergence (MACD) shows a mildly positive reading, but not enough to suggest a strong reversal is underway.
ETF Outflows Hit Record Levels
Institutional interest in Solana has weakened this week. US spot SOL ETFs recorded $17.08 million in total outflows so far, with Tuesday seeing the largest single-day outflow ever recorded at $15.40 million.

Sustained ETF outflows typically reflect institutional repositioning and can add downside pressure to spot prices.
On the derivatives side, CoinGlass data shows $7.99 million in total liquidations over the past 24 hours. Of that, $5.97 million came from short liquidations, meaning bearish traders were largely wiped out. Open Interest dropped 1.48% to $4.78 billion, reflecting reduced overall market activity.
The OI-weighted funding rate remains slightly positive at 0.0038%, and the long-to-short ratio sits at 1.0141, suggesting more traders are positioned long than short at this time.

Analyst Flags Repeated Sell-Off Pattern
Crypto analyst Ali Martinez posted on X highlighting a pattern that has played out three times since November 2025. Each time SOL briefly reclaimed the 50-day Moving Average, it failed to hold above it and was followed by a consolidation period and then a sharp sell-off.
I’ve been tracking a specific structural pattern for Solana $SOL that has been remarkably consistent since October 2025.
It’s a three-step cycle that seems to repeat every time we lose momentum.
The Anatomy of the Pattern:
• The Reclaim: SOL rallies and manages to close… pic.twitter.com/Xj6GftpKun
— Ali Charts (@alicharts) April 8, 2026
Martinez noted that the longer SOL stays below the 50-day MA, the more likely another downside move becomes based on recent price history.
Solana has been ranging between $78 and $92 for most of the time since a volatile session on March 5, when the price dropped from $92 to $78 in a single day.
On the upside, a daily close above $88 would open the path toward the 100-day EMA near $99.86. If SOL breaks below $80, the next support levels are $76.50 and potentially $47.90, which AMBCrypto identified in February as a longer-term downside target based on weekly chart structure.
SOL’s key resistance remains at $85, then $88. Support levels to watch are $82.50, $81.40, and $80.


