


 Price Predictions for August: What’s in Store?")


TLDR
- Solana (SOL) retail long positions surged to 91st percentile, showing heavy crowding near $180 resistance
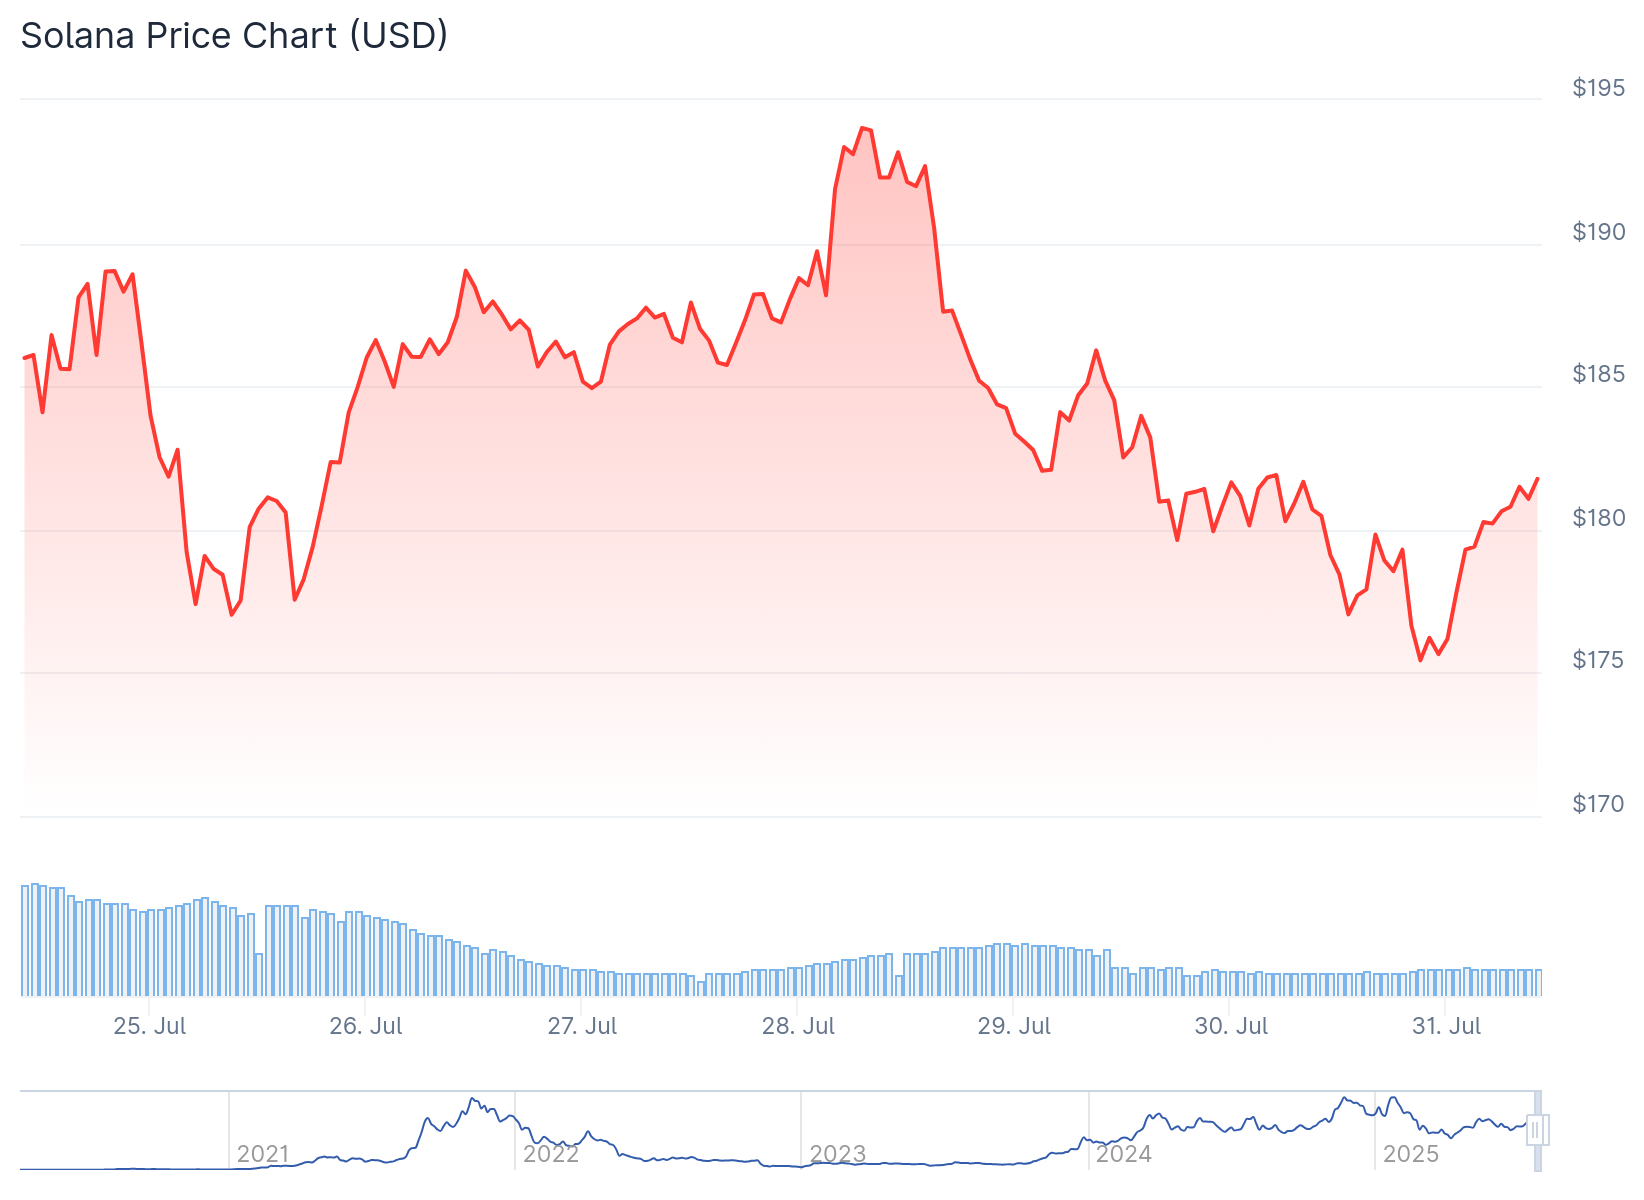
- SOL dropped from July high of $206 to around $180, giving up nearly half its monthly gains
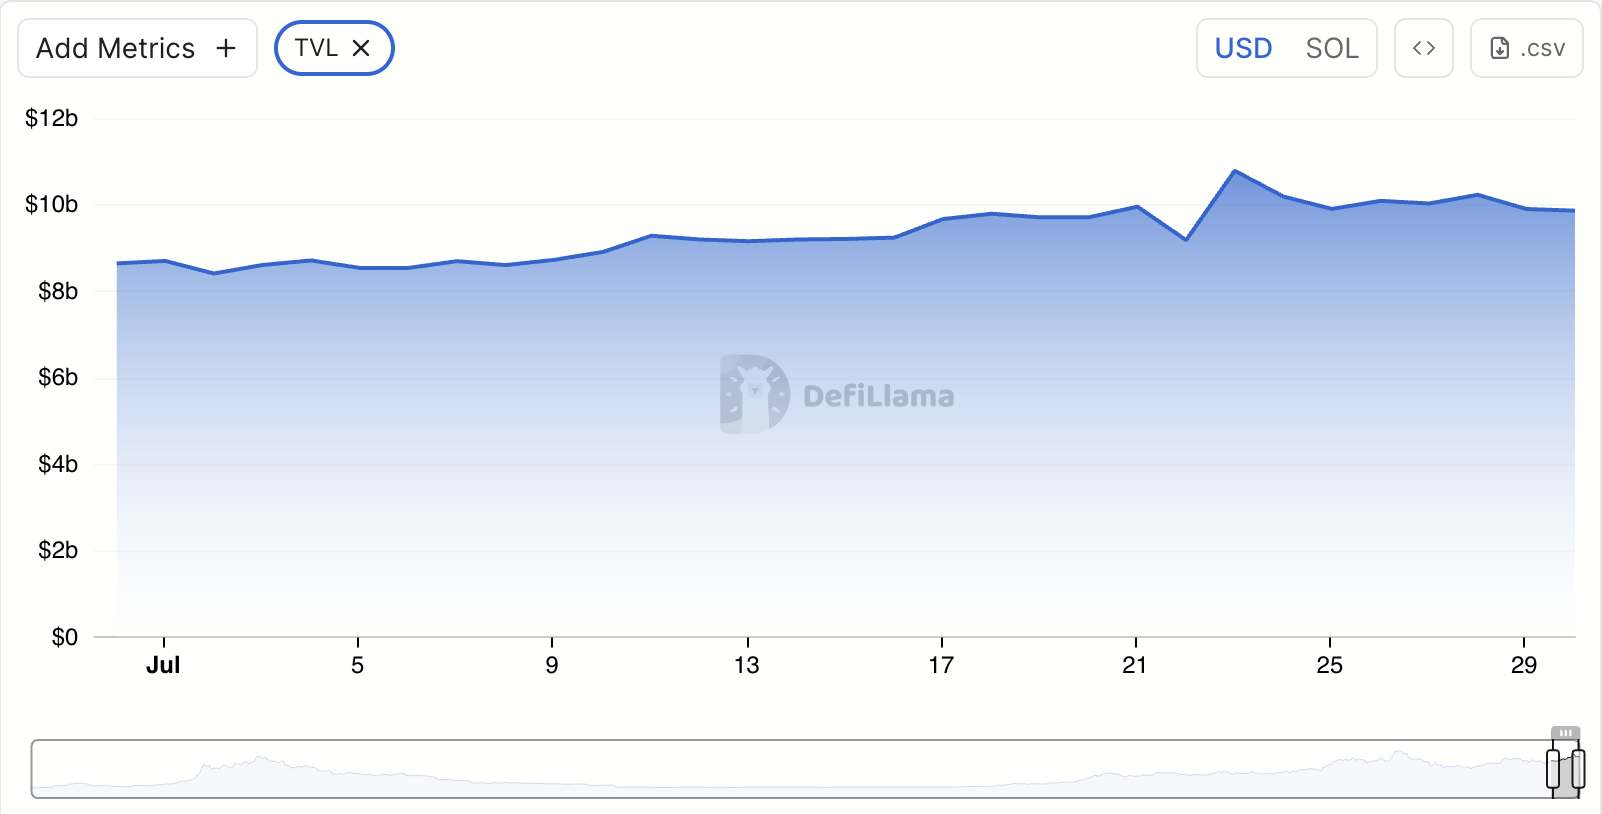
- Solana’s DeFi TVL increased 14% to $9.85 billion in July, with DEX volumes up 30% to $82 billion
- Daily active addresses on Solana network declined 16% in past week, signaling reduced user engagement
- SOL price sits near critical support at $178 (20-day EMA), with potential targets at $171 if broken or $186-$190 if momentum returns
Solana price has retreated from its July highs as on-chain metrics show declining user activity. The token reached $206 on July 22 before falling back to current levels around $180.
The price decline comes as retail traders heavily favor long positions. According to Hyblock Capital data, SOL retail long positioning sits in the 91st percentile. This represents a jump from 72.68 to 75.25 in just 24 hours.
This crowding contrasts with other major cryptocurrencies. Ethereum’s retail positioning only moved from 57.12 to 58.21 over the same period, landing in the 28th percentile.
Solana price currently tests local resistance near $180. Traders have unwound nearly 80% of long-side open interest in the past day. A liquidity pocket around $183.30 holds close to $11 million in leveraged positions.
The funding rate has shifted from -0.16% to slightly positive at 0.0079%. This shows a clear pivot from short-heavy to long-biased positioning.
July Rally Boosted Network Metrics
Solana’s 40% price gain between July 1 and July 22 drove increased network activity. The blockchain’s total value locked (TVL) in DeFi protocols rose 14% to $9.85 billion.
DEX trading volumes climbed 30% over the past month. More than $82 billion in trades occurred across Solana-based exchanges during July alone.

Higher activity translated to increased revenue. Solana generated $4.3 million in July revenue, up 13% from June’s $3.81 million.
The price surge triggered wider ecosystem growth. Lending pools and vaults across the network saw increased token deposits as SOL’s value climbed.
Network Activity Shows Signs of Cooling
Recent data suggests momentum is fading. Daily active addresses on Solana dropped 16% over the past week according to Artemis data.
Fewer active addresses typically signal reduced user engagement. This reflects slowdowns in transactions, dApp usage, and overall network demand.
DeFi TVL has pulled back 8% over the past week. Users appear to be withdrawing assets from protocols or asset values are declining due to market movements.
The decline in network metrics coincides with SOL’s price retreat from July highs. The token has given up nearly half its monthly gains over the past week.
Solana Price Prediction
SOL trades near its 20-day exponential moving average at $178.25. This level serves as critical dynamic support for the token’s price action.
A break below this support could open the door for further declines. The next potential target sits at $171.78 if bearish momentum continues.
Conversely, improved market sentiment could drive SOL higher. A move above $186.40 could target the $190.47 level.
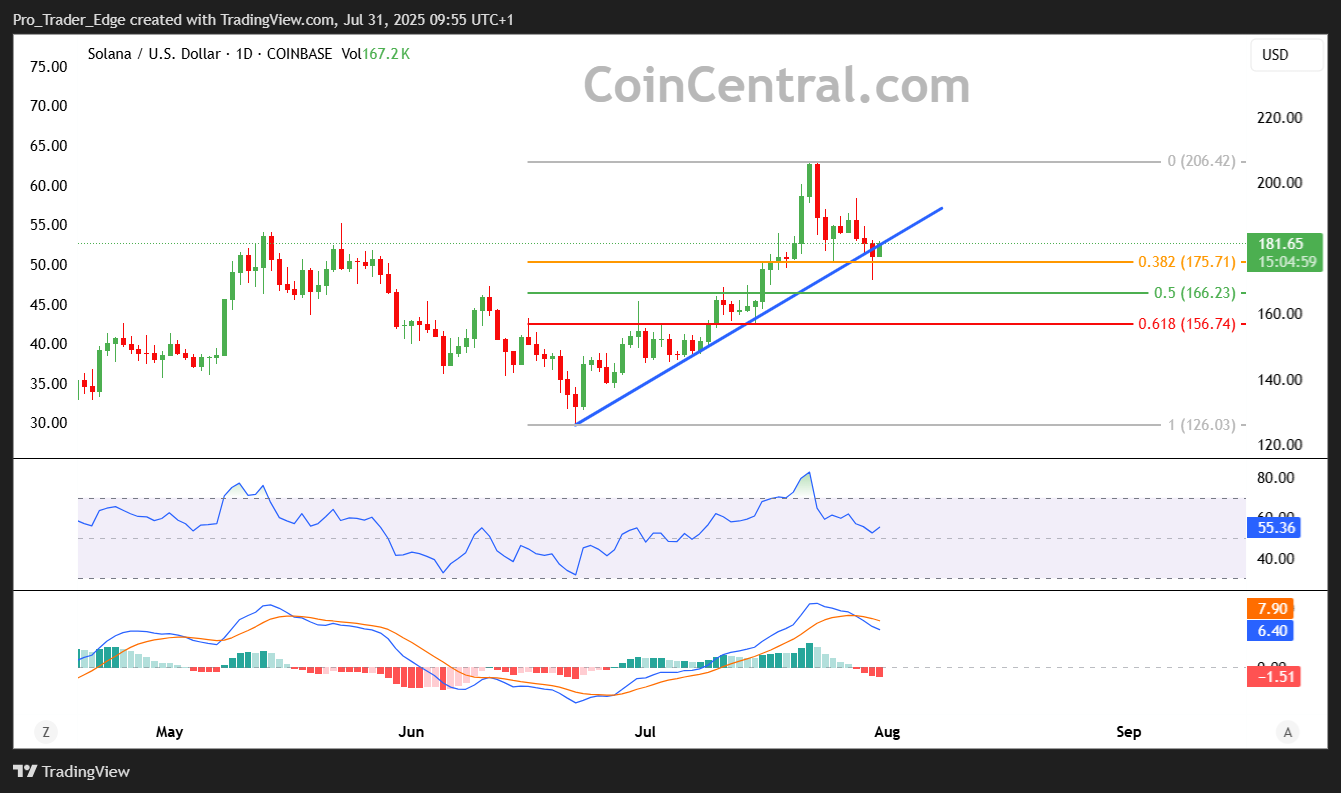
Solana Swing Trade Idea 📈
After a massive 64% rally from June lows, $SOL is finally getting a pullback.
🔹 Entry: $168
🔹 TP1: $218 ➡️ TP2 $294
🔹 Stop Loss: $125
🔹 Risk:Reward: 1:3 pic.twitter.com/3FQRbzoImY— Trader Edge (@Pro_Trader_Edge) July 30, 2025
The token has printed three straight lower daily closes. However, open interest has climbed through the pullback, suggesting position building continues.
Current price action shows SOL testing key technical levels. The 20-day EMA at $178 represents the immediate support to watch.
Recent price wicks have extended down to $178, testing this critical level. Breaking below could accelerate selling pressure toward lower support zones.


