


 Price: Revenue Hits $2.85 Billion as Chart Pattern Points to $1,300 Target")
TLDR
- Solana generated $2.85 billion in revenue over the past year, averaging $240 million monthly with a peak of $616 million in January 2025 during the memecoin boom.
- Trading platforms account for 39% of Solana’s revenue at $1.12 billion, with apps like Photon and Axiom leading the charge.
- Solana’s current monthly revenue of $150-250 million is 20-30 times higher than Ethereum’s revenue at a comparable five-year mark.
- Public companies now hold nearly $4 billion worth of SOL tokens on their balance sheets, with 18 tracked entities holding 17.8 million SOL combined.
- A cup and handle pattern on Solana’s weekly chart suggests potential price targets of $787 and $1,314 if the pattern breaks above the $295 neckline.
Solana generated $2.85 billion in revenue between October 2024 and September 2025, according to a report from 21Shares. The network averaged approximately $240 million per month during this period.

Revenue peaked at $616 million in January 2025. This spike coincided with the memecoin boom led by tokens like Official Trump. After the initial frenzy subsided, monthly revenue stabilized between $150 million and $250 million.
Solana validators earn revenue from transaction fees across the ecosystem. These fees come from decentralized finance applications, memecoins, AI apps, decentralized exchanges, DePIN projects, launchpads and trading tools.
Trading platforms represent the largest revenue source for Solana. They account for 39% of total revenue, bringing in $1.12 billion. Apps like Photon and Axiom drive most of this activity.
The 21Shares report compared Solana’s performance to Ethereum’s early growth. Five years after launch, Ethereum’s monthly revenue stood below $10 million. Solana currently generates 20 to 30 times that amount.
The network’s efficiency and low fees have attracted between 1.2 and 1.5 million daily active addresses. This figure is roughly triple what Ethereum recorded at the same stage in its development.
Corporate Treasury Holdings
Public companies have increased their Solana holdings this year. Nearly $4 billion in SOL tokens now sit on corporate balance sheets. Eighteen tracked entities hold a combined 17.8 million SOL tokens.

Forward Industries leads with 6.822 million SOL. Sharps Technology follows with 2.14 million SOL. Brera Holdings rebranded to Solmate on September 18 after completing a $300 million oversubscribed PIPE raise.
ETF Applications and Price Patterns
Several Solana ETF applications await decisions from the US Securities and Exchange Commission. Deadlines for filings from Fidelity, VanEck, Grayscale, Canary and Franklin Templeton fell on Friday. Applications from 21Shares and Bitwise are scheduled for review on October 16.
The US government shutdown will likely delay these decisions. Polymarket bettors assign a 99% chance that a Solana ETF will receive approval by year’s end.
Solana $SOL looks like it’s breaking out of a cup and handle. If confirmed, the pattern points to $1,300. pic.twitter.com/RCHVmK6Vjd
— Ali (@ali_charts) October 7, 2025
Solana’s weekly chart shows a cup and handle pattern. Market strategist Ali identified this formation as a bullish setup. The cup portion reflects a long accumulation and recovery phase. The handle shows brief consolidation before a potential move higher.
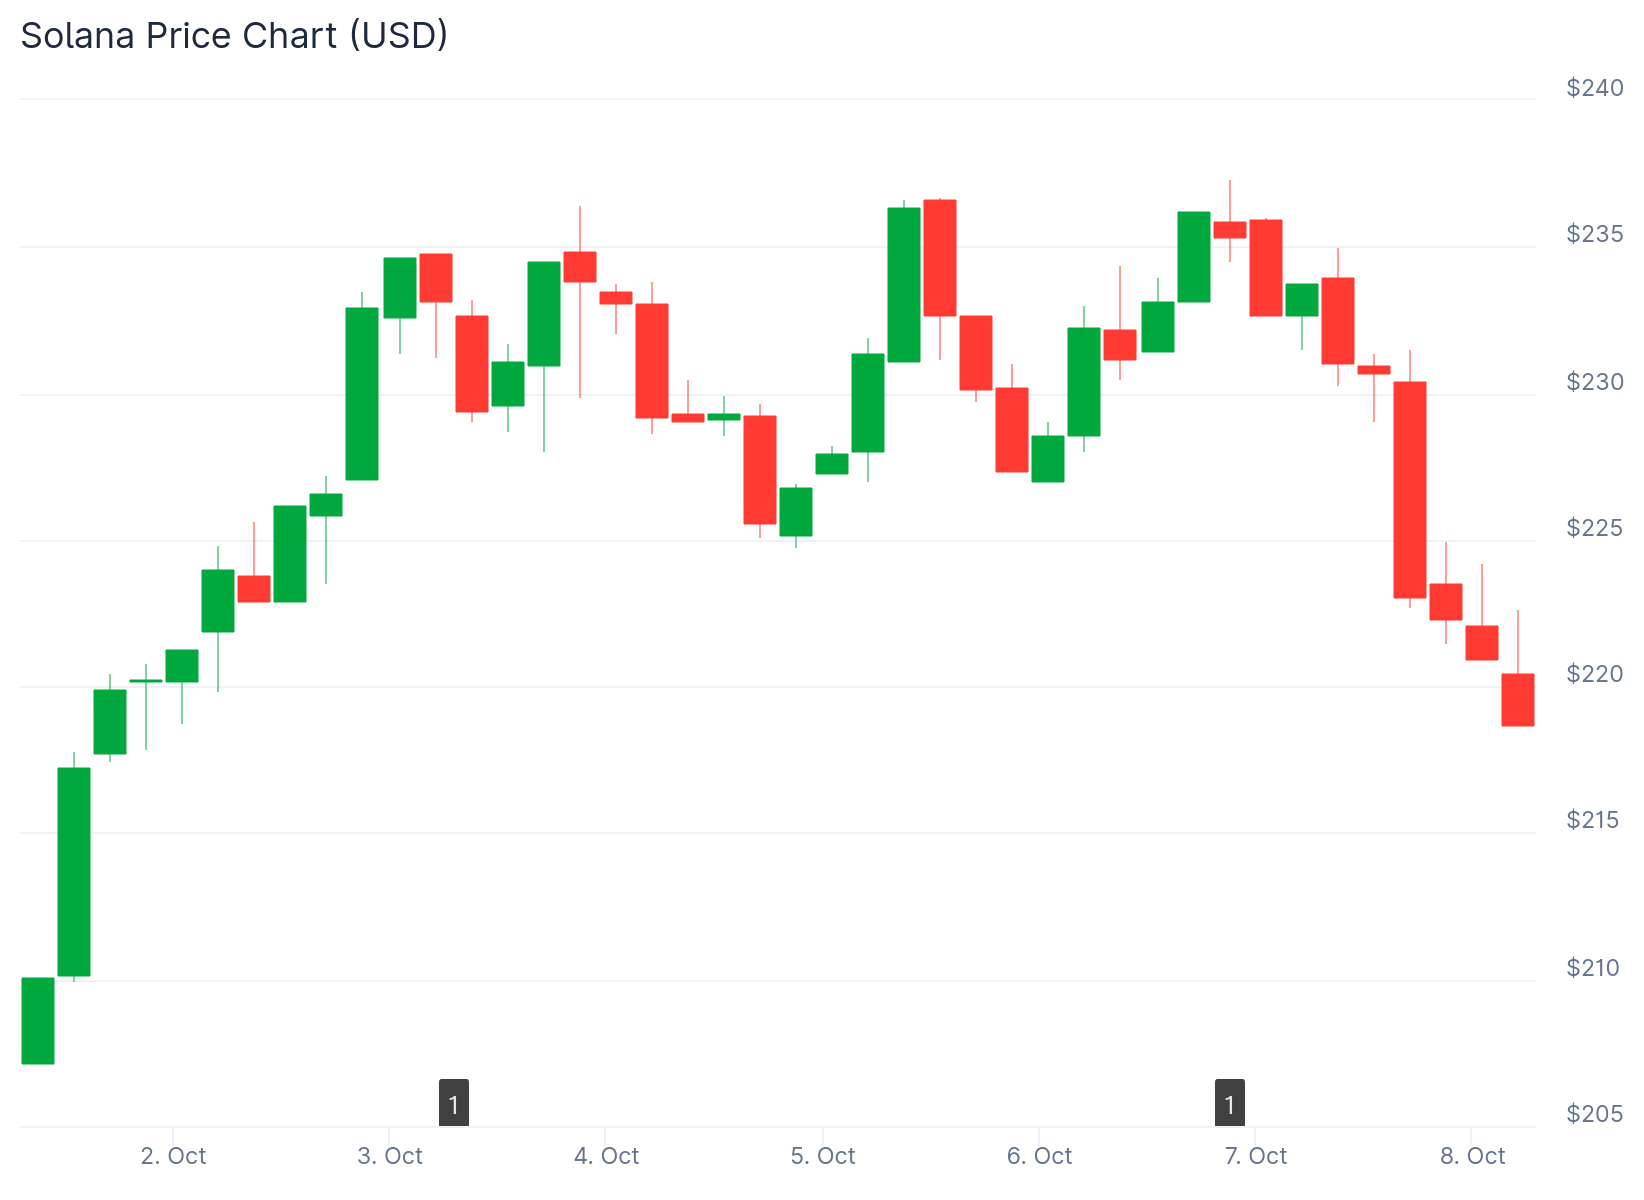
Solana currently trades around $234. The pattern’s neckline sits near $295. A decisive break above this level would validate the formation.
Fibonacci projections place potential targets at $787 and $1,314. Support remains in the $175 to $180 zone. The chart displays a pattern of higher lows since mid-2023.
The Solana ecosystem continues to expand with growing developer activity and increased adoption of decentralized applications. Institutional interest has grown in tokenization, DeFi protocols and NFT projects on the network.


