


 Price: Rising Wedge Pattern Forms as Bearish Analysts Set $60 Price Target")


TLDR
- Solana now leads all blockchains with 10,864 all-time unique developers, surpassing Ethereum’s 9,017
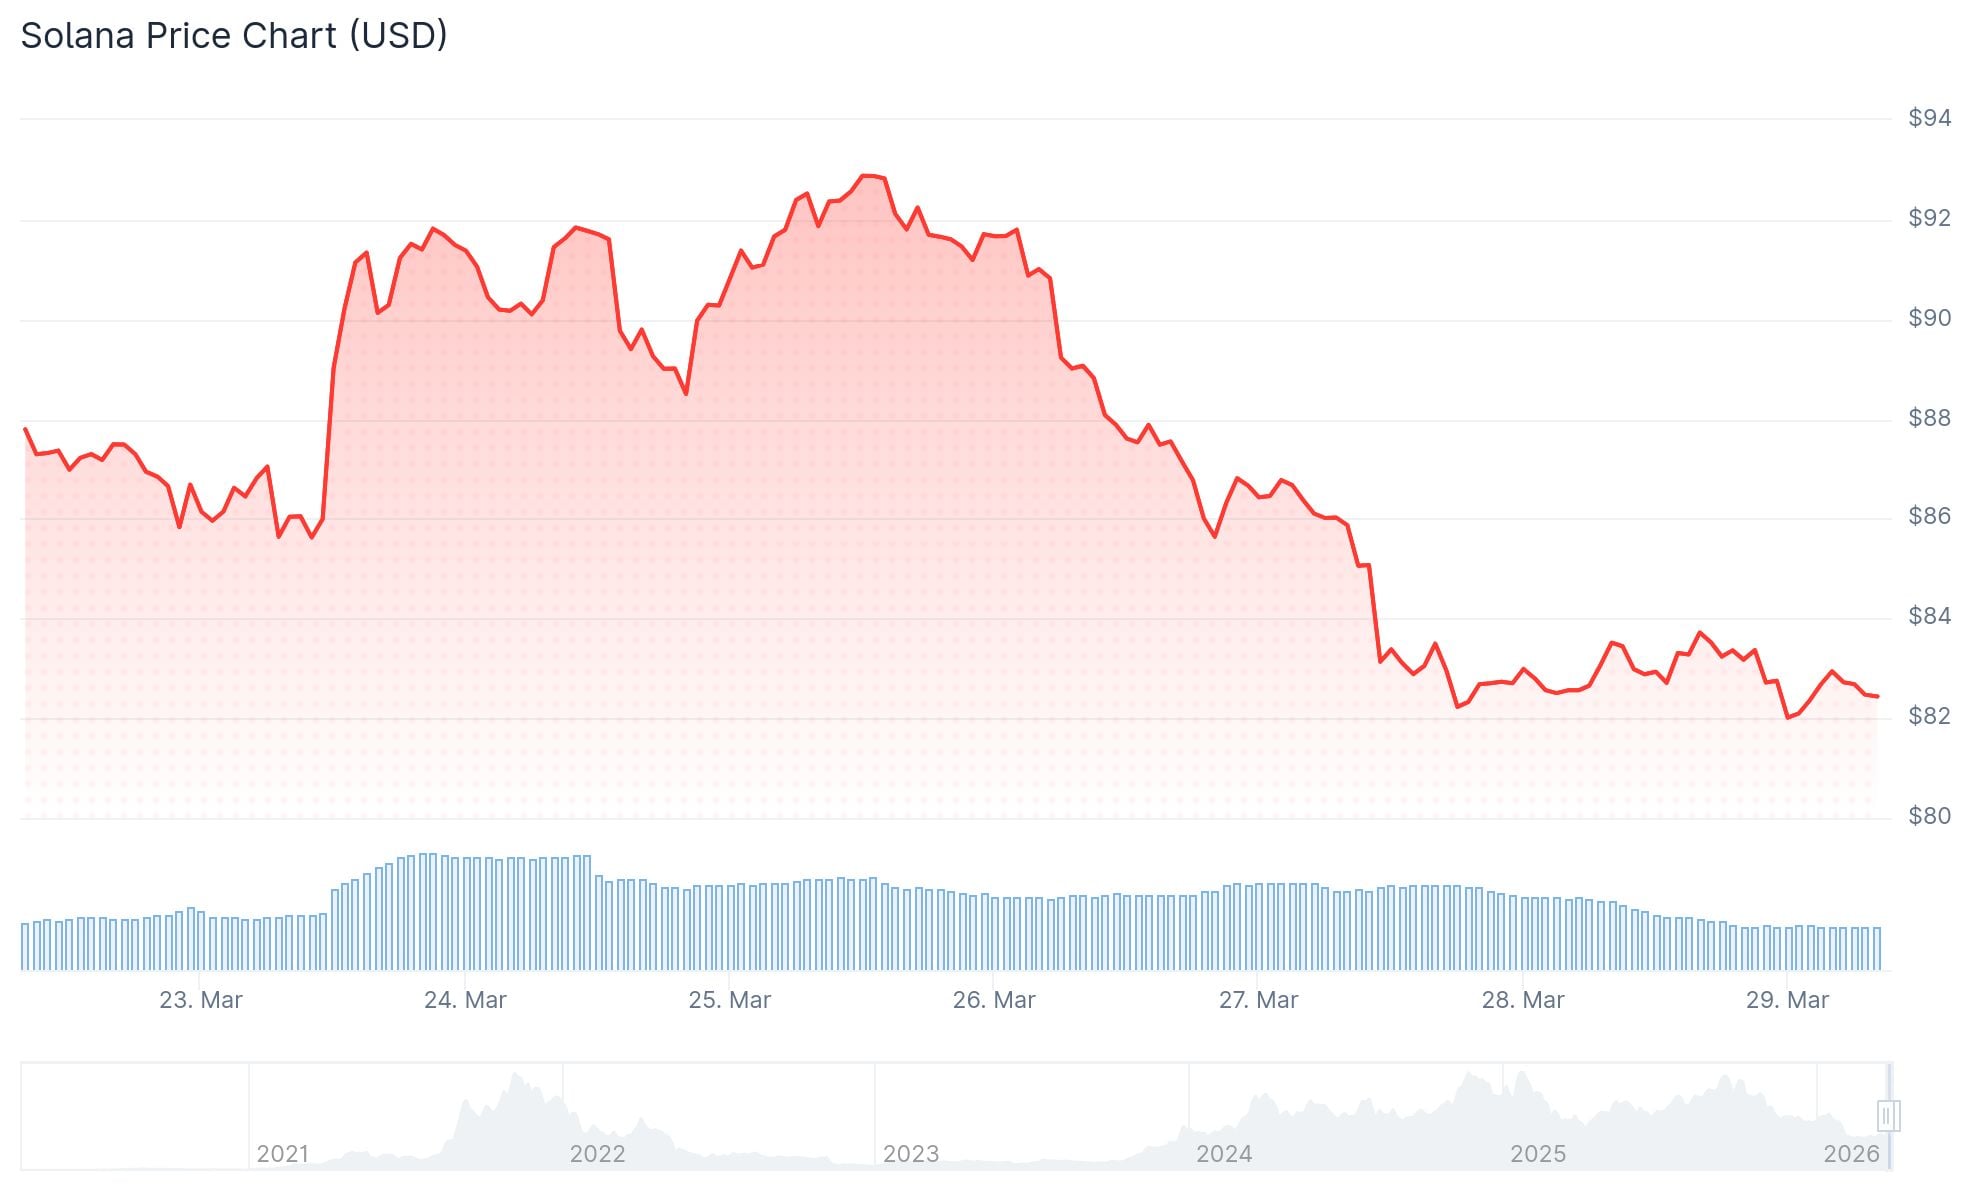
- SOL is trading around $82.70, down sharply from its 2025 peak, with analyst Wealthmanager targeting a drop to $60
- The price has been rejected from the $250 supply zone three times, signaling strong seller resistance
- DEX trader count on Solana has fallen to a three-year low, pointing to weaker on-chain participation
- Analyst Crypto Patel sees current levels near the 0.618 Fibonacci retracement as a potential long-term accumulation zone between $75 and $45
Solana (SOL) is trading near $82.70 with a market cap above $47 billion. The token has dropped over 77% from its 2025 all-time high. Broader market weakness has weighed heavily on the price despite strong network metrics.
The network itself continues to perform well. Solana has surpassed Ethereum in total all-time unique developers, with 10,864 builders compared to Ethereum’s 9,017. Polkadot trails both with 8,995. The chain is also processing over 3,000 transactions per second on a sustained basis.
But strong fundamentals have not translated into price strength. SOL has been rejected from the $250 supply zone three times. That level has become a clear ceiling where sellers have consistently stepped in.
Futures volume has dropped sharply since that peak. The bubble map data shows cooling demand across the board, with the aggressive buying that once drove the rally having stepped back.
Bearish Case: $60 in Sight
Analyst Wealthmanager points to a clear macro downtrend since the 2025 peak. SOL continues to print lower highs and lower lows. Resistance between $100 and $120 has blocked every recovery attempt.
Wealthmanager maintains a short bias and expects a move to the $60 level within two weeks. Weak bounce patterns suggest buyers lack the momentum to push back against current selling pressure.
If that level breaks, the $60–$65 demand zone is the next area to watch. That range previously supported the 2024 rally.

$SOL 2D
Rising wedge + weakening momentum
Looks like breakdownDownside expansion likely
(Trend continuation) pic.twitter.com/bQwxdTrBSM— Crypto Patel (@CryptoPatel) March 26, 2026
On the two-day chart, price action is forming what analyst Crypto Patel describes as a rising wedge pattern. This structure developed below the 200-week moving average. The setup is typically treated as a bearish continuation signal when it forms after a major decline.
The chart shows a rejection zone near the top of the wedge. If the lower boundary breaks, it would open the door to another leg lower.
On-Chain Data Weakens Further
A separate chart shared by analyst Sweep on Dune shows DEX trader activity on Solana falling to its lowest level in roughly three years. Wallet count on Solana-based decentralized exchanges surged through 2024 but has since reversed sharply.
The data tracks trader count, not total value. But the move back to multi-year lows highlights a clear slowdown in speculative participation on the network.
Long-Term Bulls Still Watching
Crypto Patel sees the current range differently from a longer-term view. He notes Solana is sitting near the 0.618 Fibonacci retracement level, between $75 and $45. This zone aligns with historical demand and prior consolidation areas.
Where Are All The Solana Maxis Now? 🤔
They Told Their Followers To Buy $SOL Above $250. Screamed "To The Moon" At ATH.
Now Price Is Below $80… And They're Silent. Not A Single Tweet Saying "Buy Now."
Funny How That Works Right?
Bullish At $250. Silent At $80. That Tells You… pic.twitter.com/SRiCYSIr5N— Crypto Patel (@CryptoPatel) March 28, 2026
He identifies this as a potential accumulation range, with long-term upside targets of $500 to $1,000 over multiple cycles. He says the structure holds as long as price does not break decisively below $45.
Analyst Moonbag echoes a similar view, pointing to price compression between support near $80 and resistance near $200. He sees a potential breakout targeting $400–$600 if market conditions improve.
At press time, SOL trades at $82.70.


