


 Price: SOL Explodes Higher — Traders Are Now Watching This One Key Level")


TLDR
- SOL surged over 7% in 24 hours, reaching a high of $97.67, with the broader crypto market up around 3.6%.
- Total value locked (TVL) on the Solana network rose 25% over the past month, signaling returning interest.
- SOL is trading above $92 and its 100-hour simple moving average, with a bullish trend line forming at $94.
- Key resistance levels sit at $98 and $100, with support at $92 and $88 if a pullback occurs.
- Solana has climbed more than 40% from its February low, with the RSI rising toward 60 from oversold levels.
Solana has posted a strong 24-hour gain, climbing over 7% to a high of $97.67 before pulling back slightly to consolidate near $95. The move comes as the broader crypto market also recovered, gaining around 3.6% over the same period.
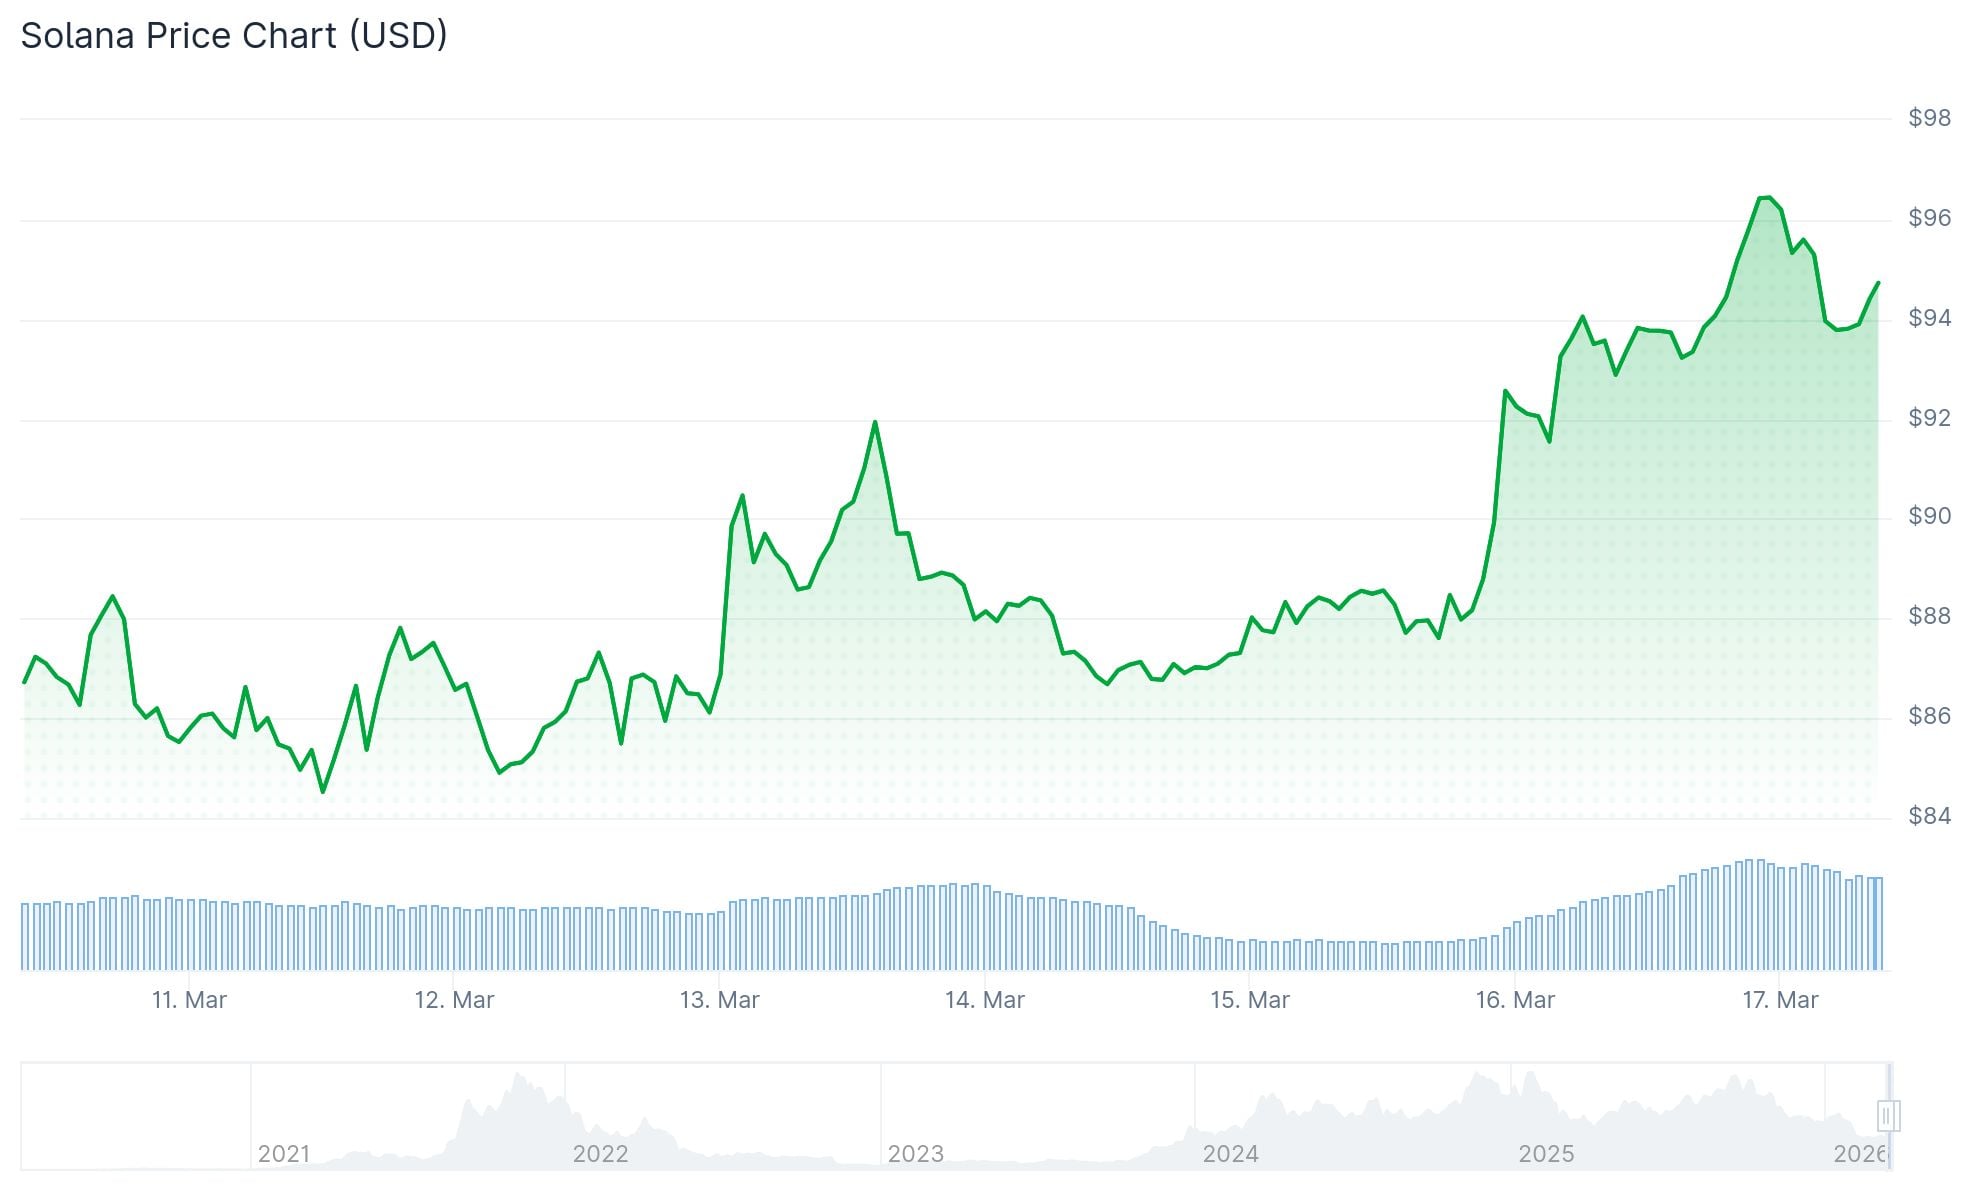
At the time of writing, SOL is trading above $92 and above the 100-hour simple moving average. A bullish trend line has formed with support at $94 on the hourly chart, based on data from Kraken.
Resistance Levels in Focus
The token is now facing resistance near $95, with the next key level at $98. The $100 mark stands as the major test. A clean close above $100 could open the door toward $105 and potentially $112.
$SOL chart has some very clean levels.
$125 – next resistance
$250 – prev ATH wkly close
$500 – measured target for c&h break out pic.twitter.com/2mTwArn1rI— Rendoshi 👽🛸 (@Rendoshi1) March 16, 2026
On the downside, if SOL fails to hold above $92, the next support is at $88. A drop below $88 could bring $82 into range.
The recent rally is partly tied to broader market recovery, but Solana has outperformed most other top-10 tokens over the same window.
the upper parameter of this range on $sol has been rejecting for weeks but looks like it may be coming to an end soon.
eth already looks like its well and truly broken out now and probably paving the way forward for the rest of the market.
time to climb the wall of worry, all… pic.twitter.com/tRkitjllxr
— Bluntz (@Bluntz_Capital) March 16, 2026

Network Activity Supports the Move
Solana’s total value locked rose 25% over the past month. TVL measures how much liquidity is sitting inside a blockchain network, and a rise of this size points to growing activity on the platform.
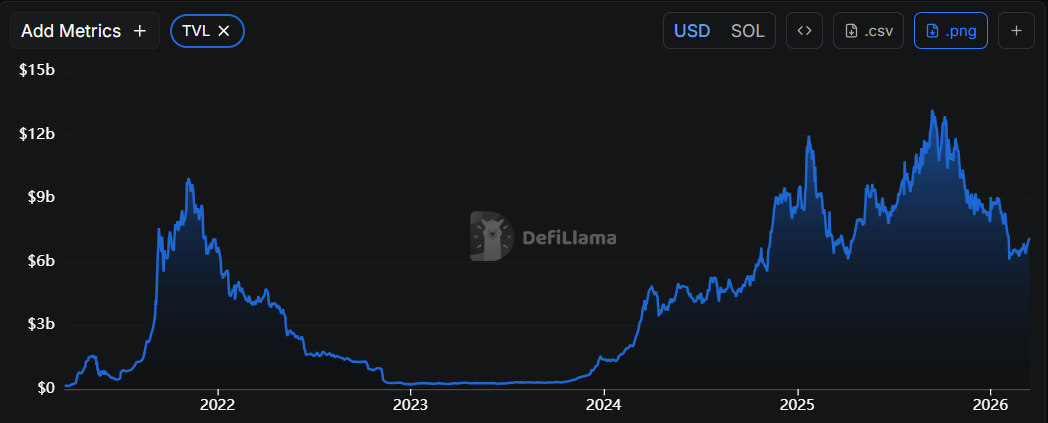
Developer activity and decentralized application launches on the network have remained steady. These on-chain signals have helped fuel the current price momentum.
Solana has gained more than 40% since its February low. The Relative Strength Index has climbed back toward 60 after bouncing from oversold levels earlier in the year.
The price has been ranging between $80 support and $95 resistance in recent weeks, forming a consolidation pattern that traders often watch for breakout signals.
The 200-day moving average remains above current price levels, which indicates the longer-term trend has not fully turned.
SOL currently sits at approximately $94.62, with a market cap around $54 billion and a 52-week range of $70.61 to $252.78.


