






TLDR
- US Solana spot ETFs recorded $1.58 million in daily inflows on August 18, bringing cumulative net inflows to $1.16 billion.
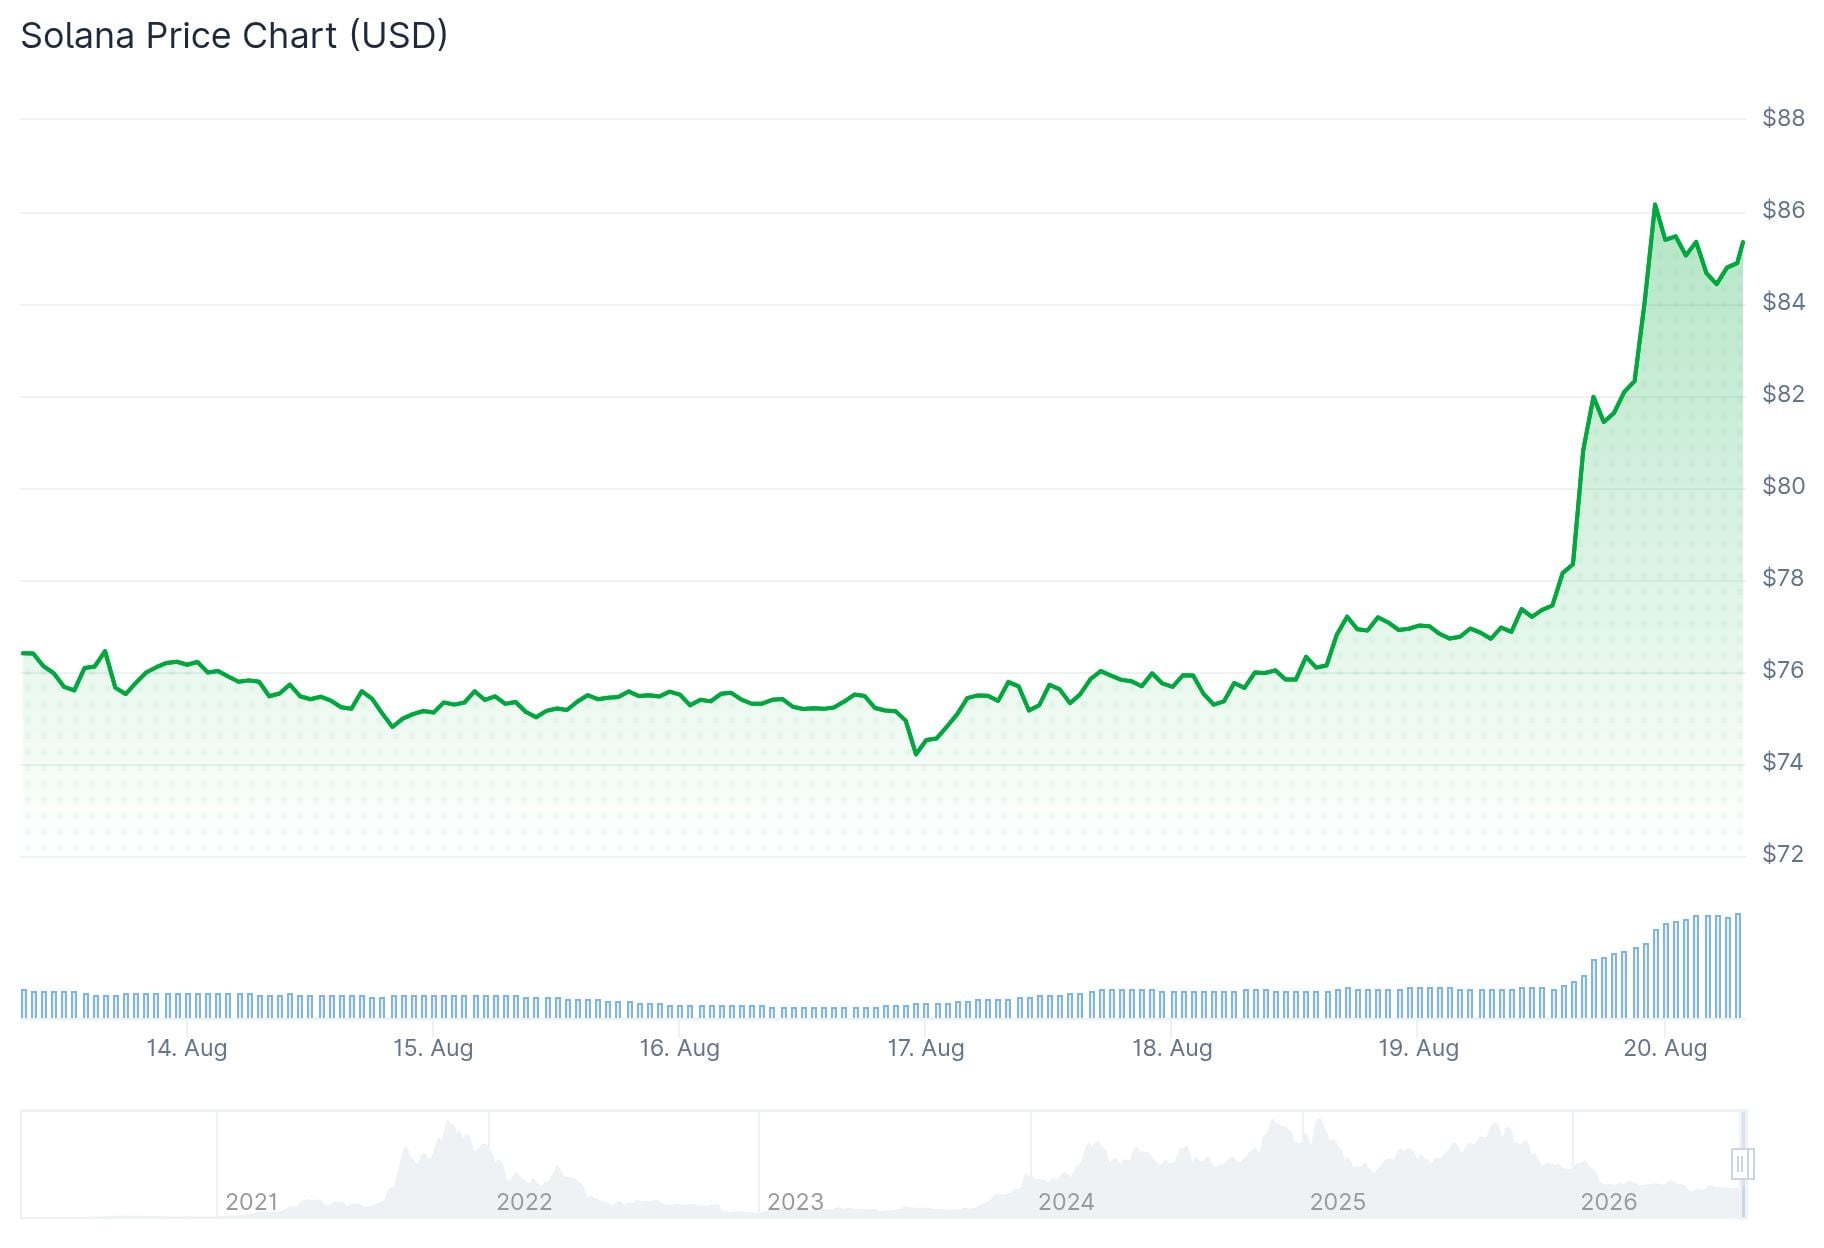
- SOL hit $86 on Wednesday before pulling back slightly to trade around $84.81.
- Analysts are watching $100 as a key level, with a decisive break above it seen as a confirmation of a market bottom.
- Long-term price targets from analyst Ali Charts sit at $295 and $400.
- Analyst Michaël van de Poppe says SOL remains ready for a strong breakout upward.
Solana touched $86 on Wednesday before pulling back slightly, and is now trading around $84.81. ETF inflows continue to build as analysts watch the $100 level closely.
US spot Solana ETFs pulled in $1.58 million on August 18, according to SoSoValue data. That brings total cumulative net inflows to $1.16 billion since the products launched.
Total net assets across the Solana ETF products stood at $923.57 million, with $30.13 million in total value traded on that day.
Bitwise accounted for the full $1.58 million daily inflow on August 18. The other listed funds recorded no new net inflows for that session.
Prior inflow days included $8.83 million on August 10 and $1.43 million on August 11. There was a small outflow of around $859,450 on August 6, showing flow has not been one-directional.
Analysts Set $100 as the Key Level
Crypto analyst Ali Charts says he is watching $100 as the main level for SOL. A clear move above it would make him more confident the market has already found its bottom.
SOLANA READY TO PUMP: WHAT I’M DOING
As I mentioned before, $SOL appears to be setting up for a bullish breakout, with $100 as the next major level I'm watching.
Whether the bottom is already in remains to be seen. Instead of trying to time it perfectly, I've been slowly… https://t.co/I0VsPps88Y pic.twitter.com/7W9Tph26l1
— Ali Charts (@alicharts) August 19, 2026

Rather than timing an exact low, Ali Charts says he has been gradually accumulating SOL using dollar-cost averaging, with a buying range between $40 and $70.
Wednesday’s $86 high puts SOL above that accumulation range, though the token still sits below the $100 threshold Ali Charts considers a key signal.
Ali Charts also outlined longer-term targets of $295 and $400, representing roughly 288% and 430% upside from his reference price. He described these as part of a long-term strategy that includes staking.
On staking, he used a gross yield of around 5.7% as an example. On 1,000 SOL, that would generate about 57 SOL per year before a 7% validator commission, leaving roughly 53 SOL kept.
Technical Picture Points Higher
Analyst Michaël van de Poppe posted on X that $SOL remains ready for a strong breakout upward, reflecting a bullish view shared by others in the market.
$SOL remains to be ready for a strong breakout upwards. pic.twitter.com/ExEWbmNNjr
— Michaël van de Poppe (@CryptoMichNL) August 19, 2026
SOL is holding above both its 50-day EMA at $76.30 and its 100-day EMA at $78.41. The RSI sits near 72, in overbought territory, while the MACD shows a positive signal line.
The next resistance to clear is the 200-day EMA at $88.82, close to the 78.6% Fibonacci retracement at $90.21.
Wednesday’s push to $86 brought Solana closer to that resistance zone. A move through $88.82 would open the path toward the $98.41 swing high and the $100 psychological level.
On the downside, support sits at the 50% retracement level of $79.27 and the 100-day EMA at $78.41.
The cumulative Solana ETF inflow of $1.16 billion, Wednesday’s $86 high, and the current price of $84.81 remain the key figures traders are tracking.


