


 Price: Strong ETF Inflows and Whale Accumulation Propel SOL Toward $200")
TLDR
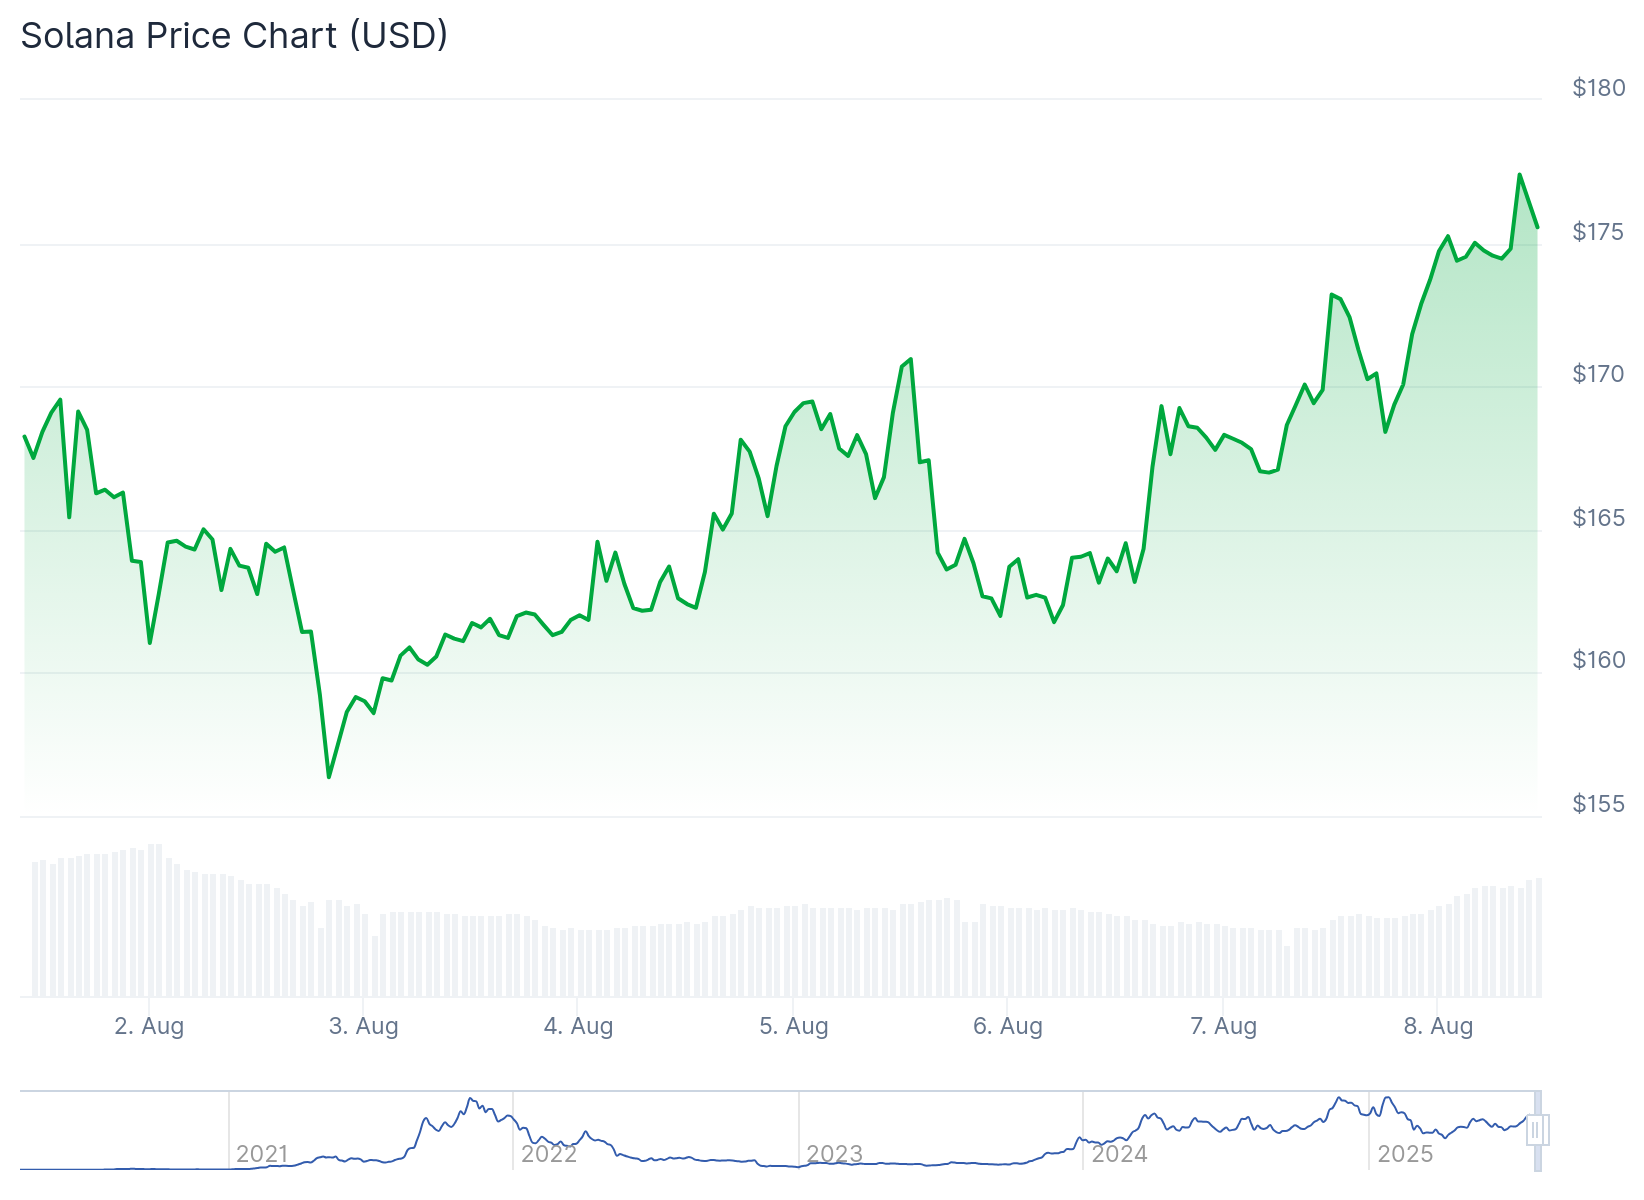
- Solana (SOL) bounced from key support around $155 and is building bullish momentum with whale and retail accumulation
- SOL ETFs have attracted $137.4 million in inflows since mid-July, showing growing institutional interest
- Solana’s Total Value Locked (TVL) reached a 3-year high in SOL terms, indicating increased protocol activity
- Technical analysis shows SOL testing channel resistance with potential breakout toward $205-$206 level
- Price predictions target $214-$250 by September based on Elliott Wave patterns and Fibonacci extensions
Solana is showing signs of recovery after bouncing from a key support level around $155. The cryptocurrency has gained momentum following its rebound from what analysts call a “golden zone” of confluence.
The bounce occurred at an overlapping ascending trend-line support and a golden Fibonacci retracement range between 0.618 and 0.7. This technical setup has created a foundation for potential upward movement.
The Stochastic RSI indicator was in oversold territory at the time of analysis. This suggests Solana may have found a local bottom, providing additional support for a bullish outlook.

On-Chain Metrics Show Dual Accumulation
Whale addresses have been quietly accumulating SOL at current trading prices according to CryptoQuant data. The Future Average Order Size data reveals increased activity from large holders.

Retail investors are also participating in the accumulation. Buyer volume among positions under $1 million has surged, showing renewed confidence from smaller investors.
This dual accumulation from both whale and retail segments creates underlying strength. The alignment between different investor groups often precedes upward price movements.
Exchange balances have dropped by 10% during recent price weakness. This reduction in available supply on exchanges suggests decreased selling pressure.

CME futures positions have remained stable throughout the recent pullback. This stability indicates institutional players are not unwinding their positions despite short-term volatility.
ETF Inflows Drive Institutional Interest
Solana ETFs have attracted $137.4 million in net inflows since mid-July. These inflows represent growing institutional confidence in the cryptocurrency.
$SOL will be the 3rd best crypto ETF in the future! pic.twitter.com/tIZS4jzmqt
— Jesse Peralta (@TheJessePeralta) August 6, 2025
The ETF performance includes spikes like the $13.4 million inflow recorded on July 24th. While daily consistency varies, the overall trend shows sustained institutional interest.
The early inflow trajectory resembles foundational build-up phases seen in other maturing institutional products. This pattern suggests potential for continued growth in institutional adoption.
Despite brief pauses in recent sessions, the momentum from ETF inflows remains intact. The capital flows are positioning Solana as a potential third-best-performing crypto ETF.
Total Value Locked (TVL) on Solana has reached a 3-year high in SOL terms. This metric reflects increasing user commitment and protocol activity on the blockchain.
The TVL milestone represents more than just dollar-denominated growth. It shows native assets being staked, borrowed, or deployed across DeFi protocols at levels not seen since the last cycle’s peak.
Technical analysis shows SOL testing descending channel resistance that has defined recent price action. Repeated approaches toward the upper band, combined with declining sell volume, suggest sellers may be losing control.
A breakout from this technical structure could trigger movement toward the $200-$206 region. This level represents both psychological resistance and a confluence of prior breakdown levels.
The daily chart shows early formation of a golden crossover pattern. This classic momentum signal adds weight to the bullish technical outlook developing across multiple timeframes.
Elliott Wave analysis suggests SOL is in the early stages of a new impulsive wave. Fibonacci extension targets point to potential moves toward $214 and $250 levels.
Current price action maintains an intact channel structure supporting moves toward previous all-time highs. The timeline for reaching these levels extends to late August or early September based on wave patterns.
Key resistance remains at the recent local high of $206 where sellers previously overwhelmed buyers. Breaking this level would confirm the bullish breakout scenario suggested by technical and fundamental indicators.
Support holds at $155, which served as the launching point for the current recovery attempt. A break below this level would invalidate the near-term bullish setup.
Solana price is currently trading around $167.99, up 2.50% in the last 24 hours, with technical and fundamental factors aligning for potential continued recovery.

