


 Price: Three Bullish Signals Hint at Possible Rally Ahead")


TLDR
- Solana rebounded from $130 support level, which previously triggered rallies of 98-108% to $250-$265
- Futures open interest increased 5% to $7.3 billion with positive funding rates showing return of buyer demand
- Spot Solana ETFs recorded 15th consecutive day of inflows with $390 million in cumulative inflows
- Fidelity and Canary Capital launched new Solana ETFs, bringing total spot SOL ETFs to five
- Network metrics strengthened with 18% increase in daily active addresses over 30 days
Solana has rebounded from the $130 price level after falling 25% from recent highs of $173. The recovery started on November 11 and has created a V-shaped pattern on shorter timeframes.

Price action shows SOL forming a base near $130. This level has acted as strong support in previous trading periods.
The relative strength index climbed to 50 from 28 since November 13. This indicates increasing upward momentum in the market.
Bulls stepped in to buy after the recent drop. The recovery has pushed prices back toward current levels near $140.
On the weekly chart, the $130 level has triggered major rallies in the past. Between September and November 2024, SOL rallied 108% from $127 to $265. From June to September 2025, the price increased 98% from $130 to $250.
If history repeats, SOL could see an 80% increase from current levels back to $250. The price would need to reclaim the $160 level first as support.
Futures Market Activity Returns
Futures open interest for Solana increased 5% over 24 hours to $7.3 billion. Perpetual funding rates turned positive to 0.0059% from negative territory.

Rising open interest combined with positive funding rates shows demand returning to SOL futures markets. Net taker volume has flipped positive, meaning more buyers are entering at lower price levels.
Spot cumulative volume delta is rising alongside futures activity. This indicates the recovery is driven by both spot and futures buying, which traders often view as a healthy setup.
ETF Inflows Continue Strong Pace
Spot Solana exchange-traded funds recorded their 15th straight day of inflows. US-based SOL ETFs added $8.26 million on Monday.

Cumulative inflows have reached $390 million. Total net assets now stand at over $513 million according to SoSoValue data.
Fidelity launched its FSOL ETF with a six-month fee waiver. The fund carries a 0.25% management fee and trades on NYSE Arca.
Canary Capital introduced its SOLC ETF on the same day. These launches bring the total number of spot Solana ETFs to five.
Bitwise’s BSOL manages nearly $450 million in assets. The strong performance reinforces institutional appetite for structured SOL products.
Network Metrics Show Growth
Daily active addresses on the Solana network increased 18% over the last 30 days. Daily transactions rose 9.1% during the same period.
The network expansion supports the price recovery from a fundamental perspective. More activity typically indicates growing usage of the blockchain.
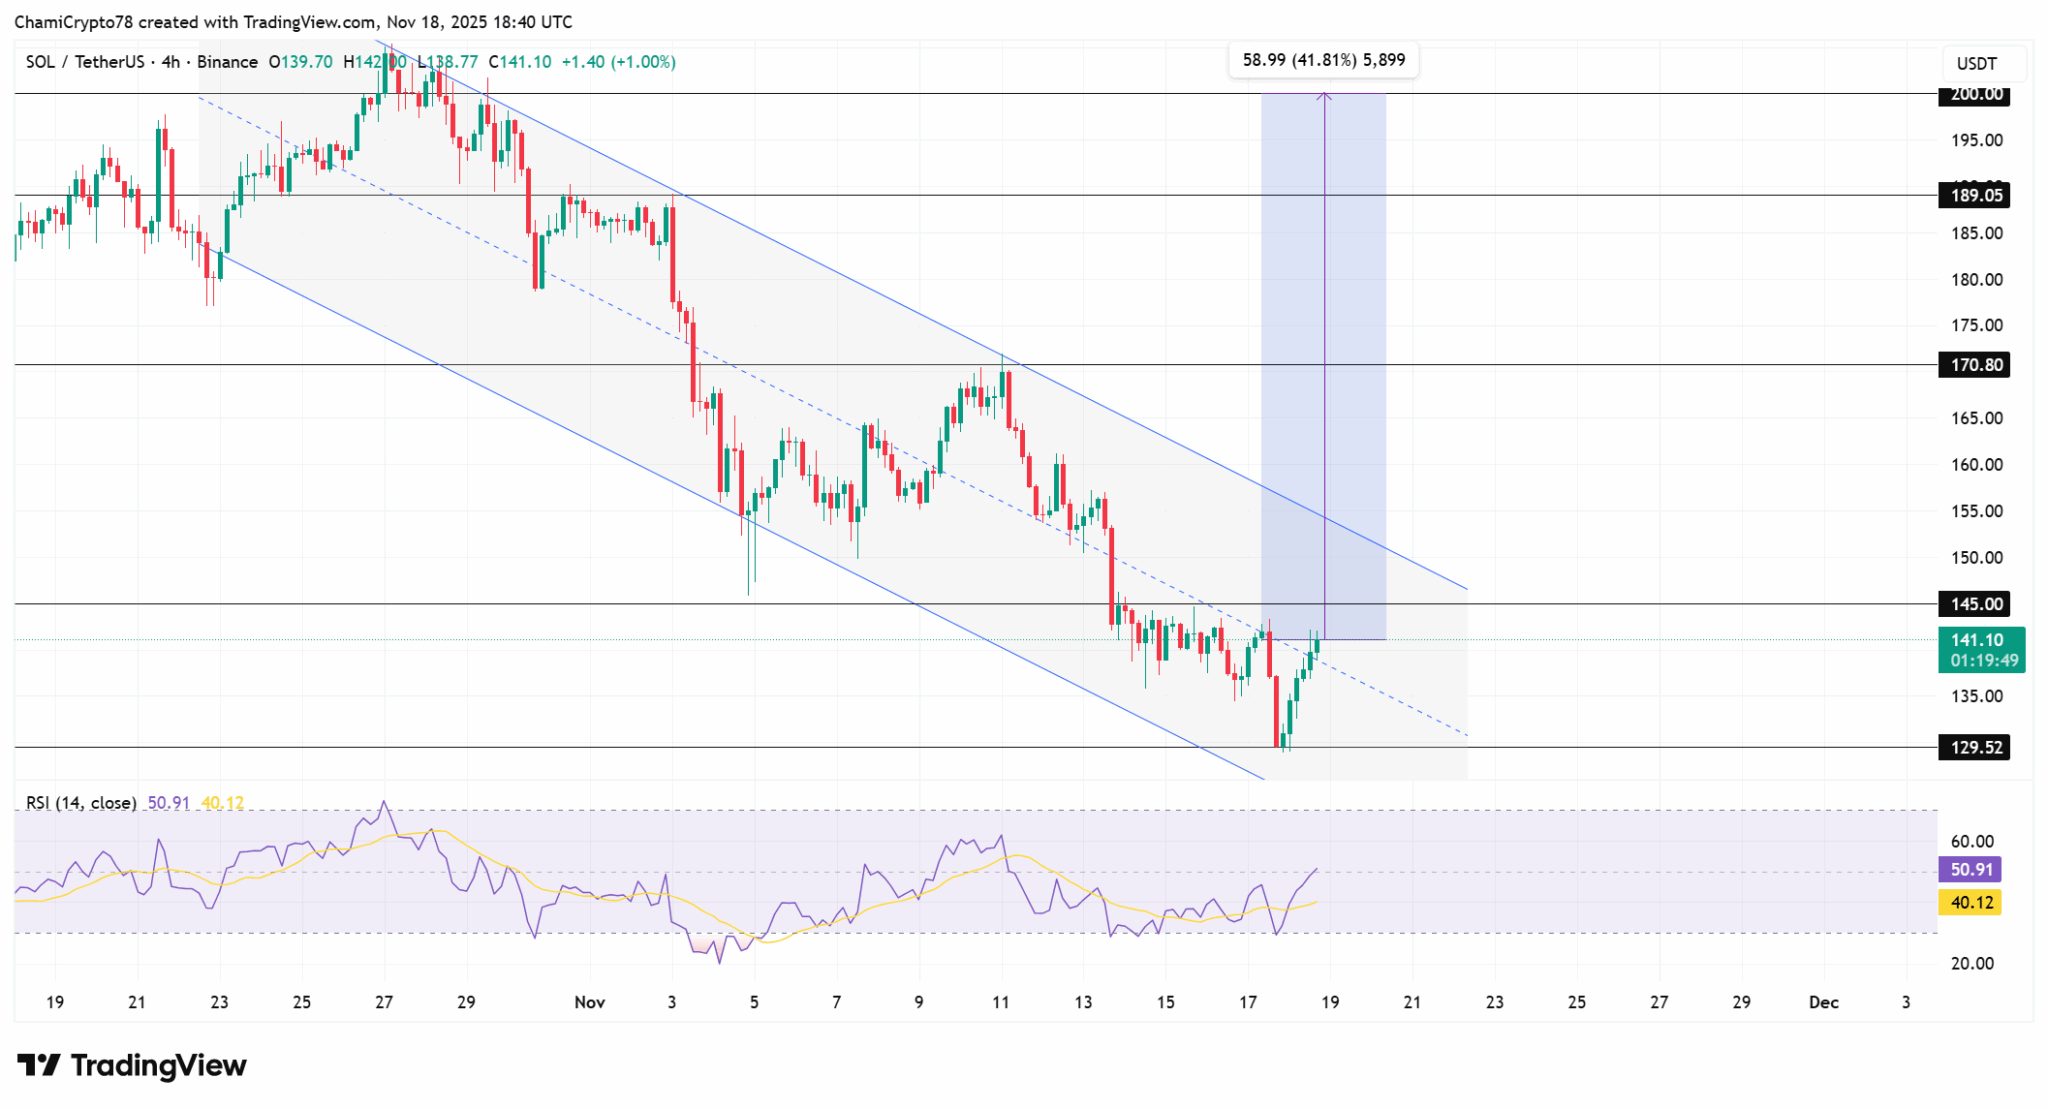
SOL price is testing the upper boundary of a falling channel pattern. A break above this level could open space toward $170 and eventually $200.


