


 Price: What the Charts Say After SOL Breaks Below $80")
TLDR
- SOL dropped below $80, hitting a low of $77.30 after failing to hold above $95
- A bearish trend line is forming with resistance at $82 on the hourly chart
- The long-to-short ratio sits at 0.89, indicating more traders are betting on further declines
- Funding rates turned negative at -0.0245%, a level last seen during the February 6 price dip
- If SOL breaks below $76.45, the next key target is the February 6 low of $67.50
Solana has dropped over 6% and is now trading below $80, extending a losing streak that stretches back six weeks to mid-January.
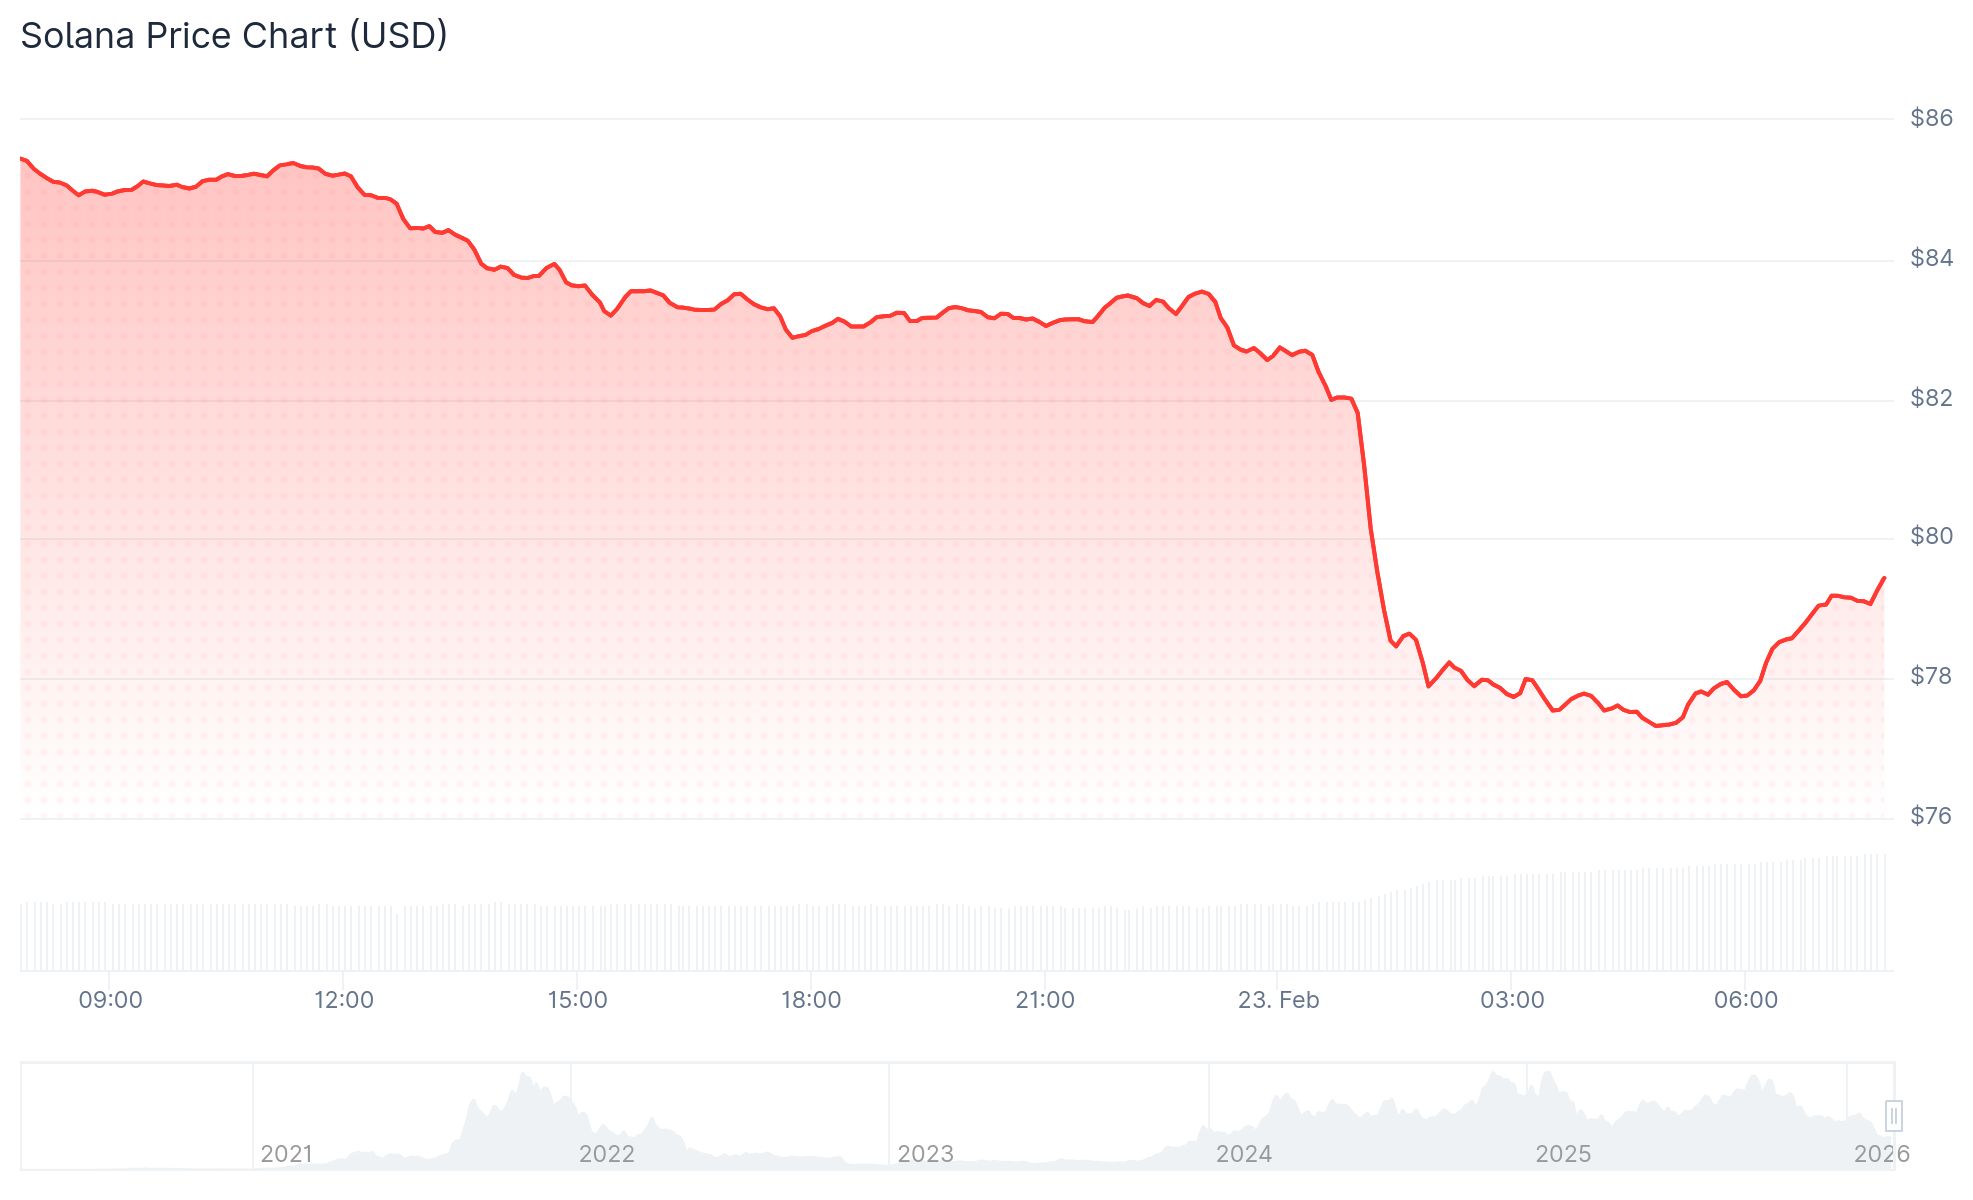
The slide began after SOL failed to hold above $95. It then broke through the $90 and $85 support levels before forming a low at $77.30.
At the time of writing, SOL is trading near $76.45, which is the lower boundary of its current consolidation range.
The price is sitting below the 100-hourly simple moving average, adding more weight to the bearish case.
On the hourly chart, a bearish trend line has formed with resistance sitting at $82. The 50% Fibonacci retracement level of the recent swing also lines up near $82, making that a key zone to watch.
For any recovery to gain traction, bulls would need to push the price back above $82 and then $83.10. A clean close above $83.10 could open the door toward $87 and eventually $92.
Derivatives Data Turns Bearish
The derivatives market is backing the downside case. According to CoinGlass, SOL’s long-to-short ratio is sitting at 0.89, near its lowest level in over a month. A ratio below 1 means more traders are positioned for the price to fall.

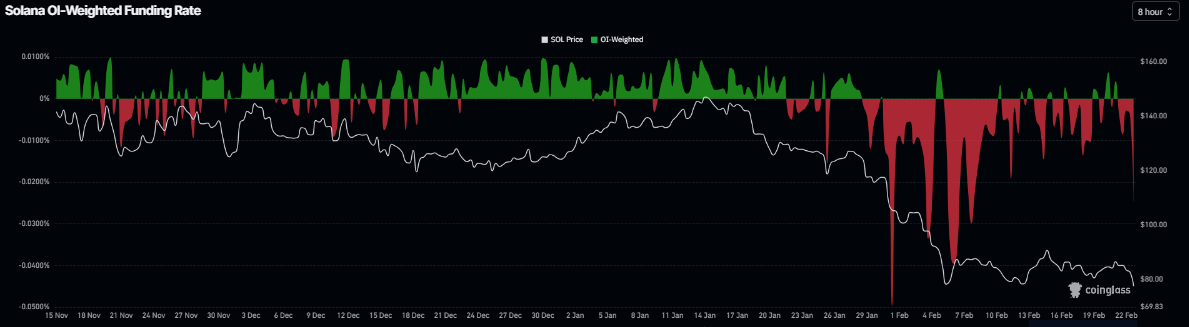
Funding rates have also flipped negative. SOL’s funding rate currently stands at -0.0245%, a level last seen around the February 6 price dip. Negative funding means short traders are paying long traders, which reflects a market leaning heavily bearish.
The RSI is reading 31, pointing downward and approaching oversold territory. The MACD lines are converging, suggesting uncertainty among traders.
Key Levels to Watch
If Solana fails to defend $76.45 on a daily close, the next major target to the downside is the February 6 low at $67.50.
This could be most likely the bottom zone for $SOL this cycle.
Where do you think Solana will bottom? pic.twitter.com/4kV9Xc3qt8
— Ted (@TedPillows) February 18, 2026
Below that, the $62 level has been identified as further support.
On the upside, $77 is the first resistance zone, followed by $82, $83.10, and $87.
SOL has now posted losses in six consecutive weeks since mid-January.
The February 6 low of $67.50 remains the key level that analysts are watching if selling pressure continues.


