


TLDR
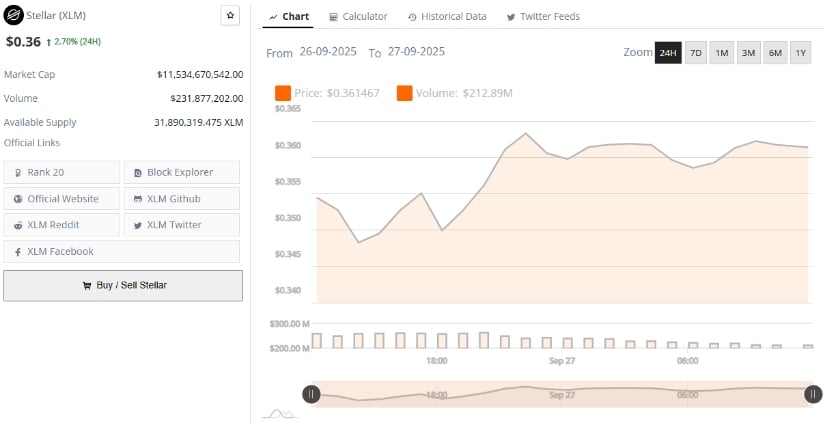
- Stellar (XLM) is trading at $0.36 with a market cap of $11.53 billion.
- XLM is facing resistance near $0.38, with $0.34 support crucial for recovery.
- Trading volume for XLM over the last 24 hours is $231 million.
- Technical indicators show tight range, awaiting clear direction for XLM.
Stellar (XLM) is currently navigating a pivotal moment, with the $0.34 support level being tested multiple times. As it holds steady, the potential for a recovery toward the $0.40–$0.50 range remains in play. However, traders are closely watching this zone, as a break below could lead to a swift decline, while a decisive push past resistance could signal a more bullish outlook for the token.
Stellar’s Current Price Action
XLM is trading around $0.36, showing slight positive movement of 2.7% in the last 24 hours. The token’s market cap is valued at $11.53 billion, positioning it as one of the top 20 cryptocurrencies by market rank. Recent price action has been confined to a narrow channel, with the $0.34 support zone acting as a key point of defense. A strong hold at this level is crucial for the continuation of a potential upward move.
The token has encountered resistance multiple times, with the $0.40–$0.50 range being eyed as a recovery target. For XLM to experience a breakout, it must close above its current resistance, ideally with strong volume. Failure to maintain support at $0.34 could signal a sharp decline in price, leaving the market on edge.
The Role of Key Support at $0.34
The $0.34 support level has become central to XLM’s short-term outlook. Traders are carefully monitoring this zone as it has been retested multiple times, with buying pressure each time preventing a deeper breakdown. If the support holds, the likelihood of a move toward the $0.40–$0.50 range remains in play. However, if the price slips below this level, it could quickly lead to a drop towards lower levels, with $0.30 acting as the next psychological support.
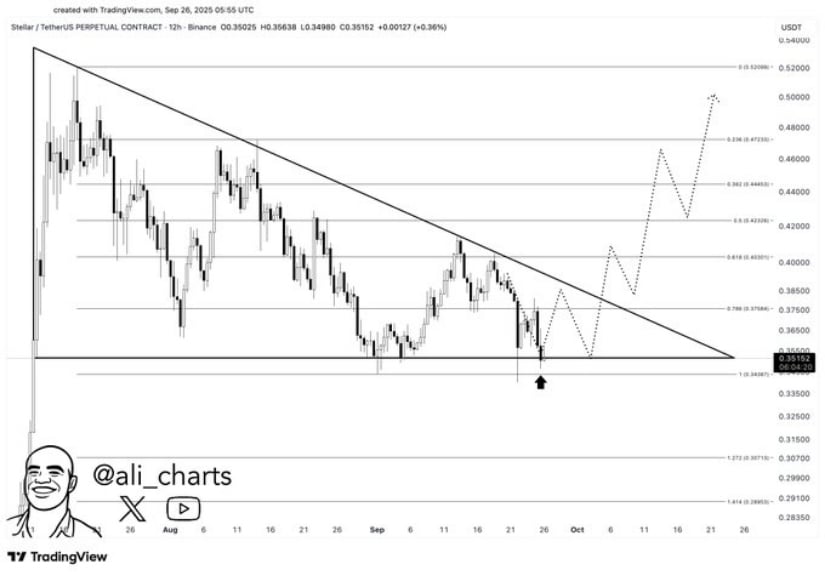
Past accumulation phases for XLM have shown similar patterns of testing key support levels before staging strong rebounds. While the price action is not as aggressive as it once was, the ongoing consolidation around $0.34–$0.36 suggests the market is waiting for a decisive move, either upward or downward, to shape the next phase.

Technical Indicators Reflect Market Uncertainty
On the technical front, XLM is caught in a squeeze between the upper and lower bands of the Bollinger Bands. The basis line, at $0.3810, serves as the upper boundary, while the lower band rests at $0.3519. This narrow range signifies market indecision, with the price oscillating between these points. A breakout above $0.38 could bring the $0.40–$0.50 range into focus, but such a move requires confirmation through volume and momentum.
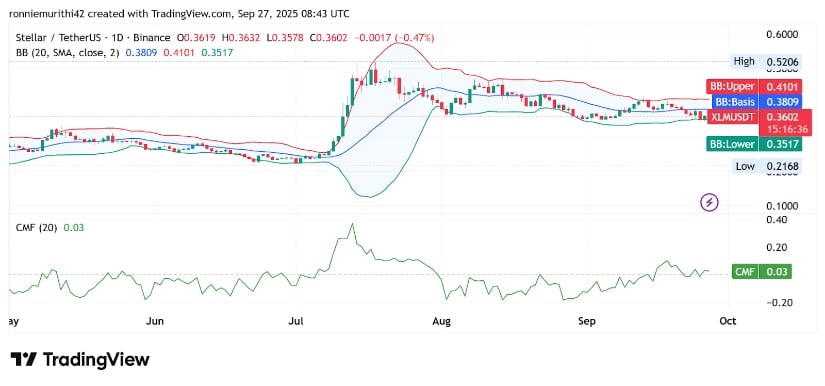
In addition to the Bollinger Bands, the Chaikin Money Flow (CMF) is sitting at +0.03, showing a faint buying pressure. However, this remains insufficient to overpower the neutral market sentiment. The technical outlook suggests that while XLM may not be in a sharp downtrend, it has yet to break free of the ongoing consolidation phase.
Market Sentiment and Trading Volume
Despite a slight price increase, market sentiment remains cautious. Trading volume over the last 24 hours came in at $231 million, indicating that traders are actively participating but with a sense of hesitation. As of now, the market is watching the $0.34 level to determine whether the token can maintain this crucial support or if the bears will take control.
With over 31.89 billion XLM tokens in circulation, the cryptocurrency remains firmly within the top 20 by market capitalization. However, the current market structure is one of uncertainty, with traders waiting for clear signs of a breakout or breakdown. The near-term outlook will depend on how the market responds to the critical $0.34 support level in the coming sessions.


