


TLDR
- UNI price struggles at $7.49, with the $7.18 support level under close scrutiny.
- Uniswap’s market cap is $4.48 billion, with daily trading volume of $373 million.
- MACD indicator shows strong bearish momentum for Uniswap in the short term.
- If $7.18 support fails, UNI may drop to the $6.50–$6.80 demand zone.
Uniswap (UNI) is facing pressure as it struggles to maintain its price above key support levels. Currently priced at $7.49, the token is nearing the crucial $7.18 support. The cryptocurrency’s price has been on a downward trend after a breakdown from the $10.00–$12.00 range. Traders are closely watching this support zone, as its failure could lead to further declines.
Sellers Remain in Control of the Market
Recent price action shows that Uniswap’s price has been consistently trending lower. Sellers have maintained control since the token failed to sustain levels above $9.00. UNI is now hovering just above a crucial support zone at $7.18, which, if broken, could lead to further price drops. The market is under bearish pressure, with sellers dominating the short-term outlook.
Attempts to reclaim higher price levels have repeatedly failed. UNI faced rejection in the $8.20–$8.50 range, highlighting the weakening bullish sentiment. Despite some volume activity, the asset continues to show signs of weakness. Sellers are firmly in charge, and the next critical test for UNI lies at the $7.18 support.
Key Levels to Watch: $7.18 and $6.50–$6.80
The $7.18 support level is now under scrutiny. If buyers manage to defend this price, a potential rebound toward the $8.20 resistance is possible. Some market analysts suggest that large buyers may be preparing for an accumulation phase, which could drive a short-term rally.
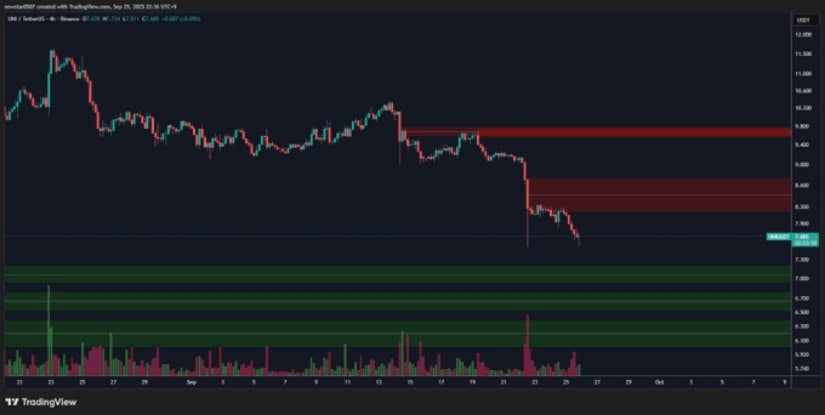

However, if UNI fails to hold the $7.18 level, the price may drop further toward the $6.50–$6.80 demand zone. This region represents the next potential support area, where buying activity could stabilize the price. Whether UNI bounces from this level or continues to decline will depend on how strong the demand is in this zone.
Technical Indicators Signal Bearish Momentum
Technical indicators reflect the ongoing bearish momentum in the market. The MACD shows a confirmed bearish crossover, with the MACD line below the signal line. This pattern suggests that selling pressure remains dominant, and there is no immediate sign of a reversal. Traders generally interpret such signals as an indication of continued downward momentum.
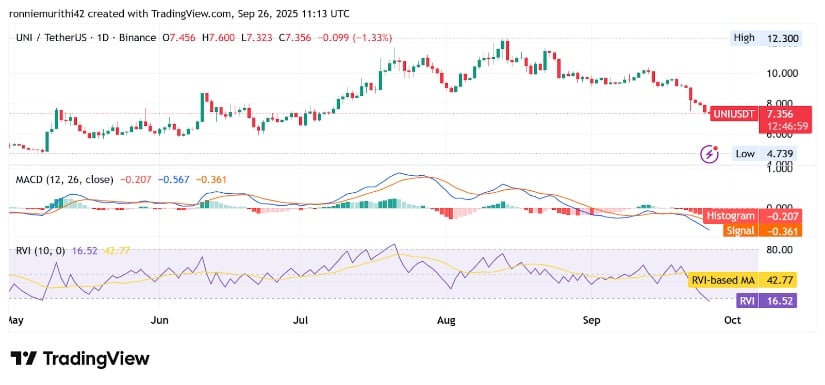
The Relative Vigor Index (RVI) is also at low levels, sitting at 16.53. This indicates that UNI is in an oversold condition, but it also suggests a lack of strong bullish conviction. A reading this low could trigger relief rallies, but with no clear recovery signals, the price may stay under pressure for now.
Market Data and Trading Activity
Currently, UNI has a market capitalization of $4.48 billion, with a 24-hour trading volume of $373 million. This indicates active trading, but the volume is skewed toward selling rather than buying. The coin remains one of the leading DeFi tokens, but the lack of bullish follow-through raises concerns about its near-term performance.
To shift the current market sentiment, UNI would need to break above $7.50 and push past the $8.20 resistance level. Until then, the short-term outlook remains bearish, and traders should watch these key levels closely to gauge the future direction of the token.

