


TLDR
- XRP is trading at $1.42 with a market cap of $87.93 billion and $1.09 billion in 24-hour volume
- Price is consolidating near 20-day and 50-day EMAs, showing a compression pattern
- RSI sits around 54–55, reflecting neutral-to-cautiously bullish momentum
- A break above $1.45–$1.50 could open the path toward $3.00
- A drop below $1.10 support could push price toward $0.90
XRP is currently trading at $1.42, holding steady over the past week with little movement in either direction. Volume over the last 24 hours came in at $1.09 billion, down roughly 4%.
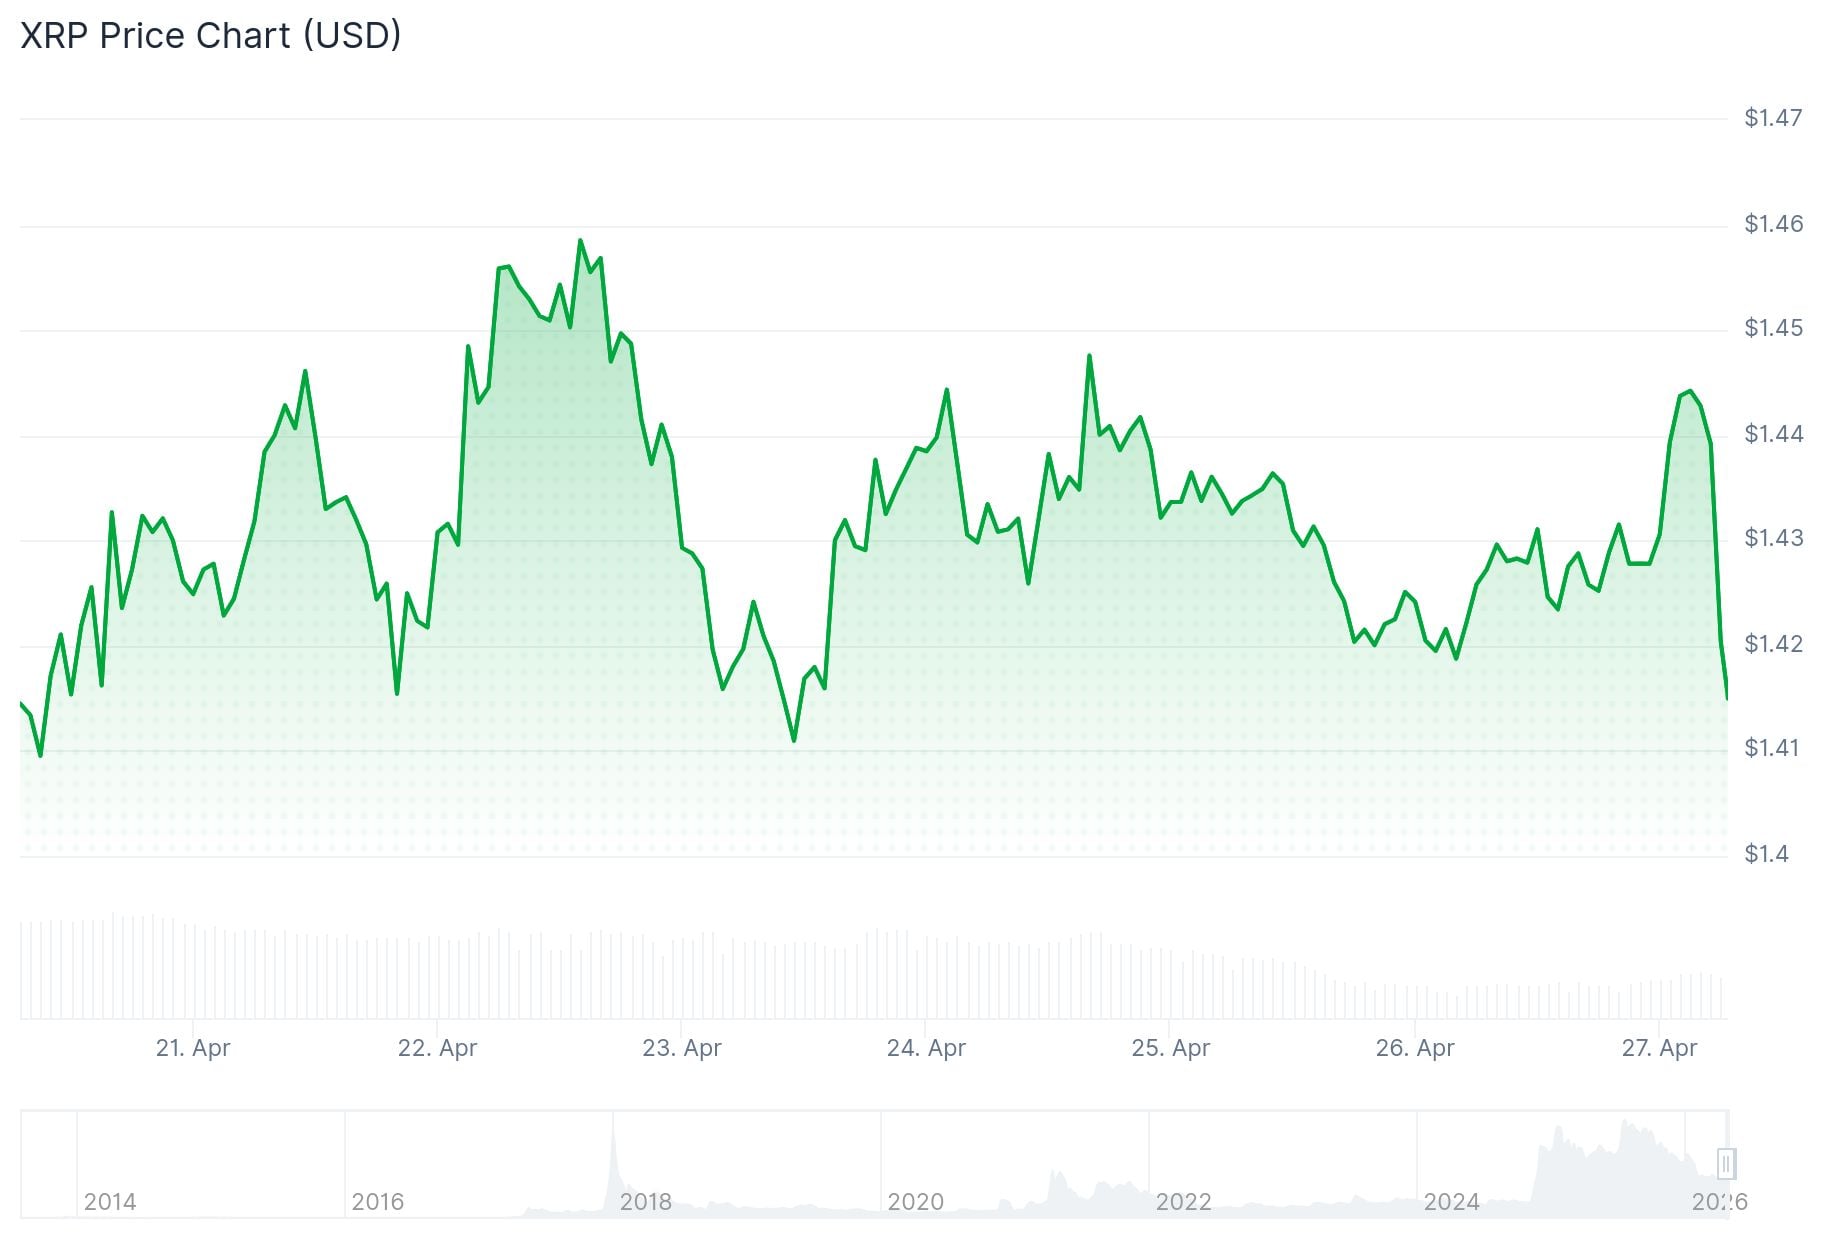
The market cap sits at $87.93 billion, which has remained stable. This points to a period of quiet consolidation rather than active selling or buying pressure.
Analyst EGRAG CRYPTO noted that traders are shifting from candlestick charts to line charts. This filters out short-term price noise and reveals a cleaner picture of the macro trend.
#XRP – Monthly EMA + Wave 3⃣ Setup:
1⃣ EMA Signal:
▫️Holding 50 EMA (Monthly)
▫️Last cycle wicked to 100 EMA → final buy zone
👉 Now: selling pressure fading, structure stronger2⃣ Key Hypothesis:
▫️No deep repeat this time
▫️50 EMA = base
▫️Possible shallow wick to 100 EMA… pic.twitter.com/pcBunmg1Rn— EGRAG CRYPTO (@egragcrypto) April 25, 2026
According to EGRAG CRYPTO, XRP is showing a compression pattern — price forming lower highs into a defined support zone. This type of structure can signal re-accumulation before a larger move.
The 50 EMA is currently acting as support on the monthly chart. EGRAG CRYPTO also flagged the possibility of a shallow wick toward the 100 EMA before any expansion phase begins.
Short-Term Technical Picture
On the hourly chart, XRP pushed up to $1.4471 before pulling back slightly. The price is holding above the 100-hourly Simple Moving Average and a bullish trend line with support near $1.4320.

$XRP has been going sideways despite BTC upward move.
This sideways action has led both bulls and bears to get aggressive.
On the upside, a decent chunk of short-side liquidity has formed above the $1.5 level.
On the downside, there's a decent liquidity cluster below the $1.4… pic.twitter.com/QHg3WglTaL
— Ted (@TedPillows) April 26, 2026
Short-term EMAs — the 10, 20, 30, and 50 periods — are all trending below the current price and flashing buy signals. This suggests pullbacks are being bought at lower levels.
The first major resistance sits at $1.45. A clean break above that level could open moves toward $1.4650, then $1.4840, and eventually $1.50. The next big hurdle beyond that is $1.5150.
On the downside, initial support is at $1.44, followed by $1.4320. A close below $1.4320 could bring $1.4050 and $1.40 into play.
Momentum and Pivot Levels
RSI is near 54–55, sitting above the midpoint after rebounding from oversold levels in February. The MACD has flashed a mild buy signal, though analysts say it is not yet strong enough to confirm a breakout.
Other momentum tools including the stochastic RSI and commodity channel index are clustered around neutral levels. This balance of indicators reflects a market waiting for a trigger.
The central pivot sits near $1.41. Immediate resistance is at $1.51, with higher levels at $1.72 and $2.04. Support below starts at $1.22, with deeper levels at $1.10 and $0.90.
XRP is currently holding just above the $1.41–$1.43 pivot zone, which analysts say will define the next directional move.


