


TLDR
- XRP dropped 61% from its July 2025 all-time high of $3.66, hitting a 15-month low of $1.11 on Feb. 5, 2026
- The Feb. 5 crash helped XRP retest the upper trendline of a multi-year symmetrical triangle it broke out of in November 2024
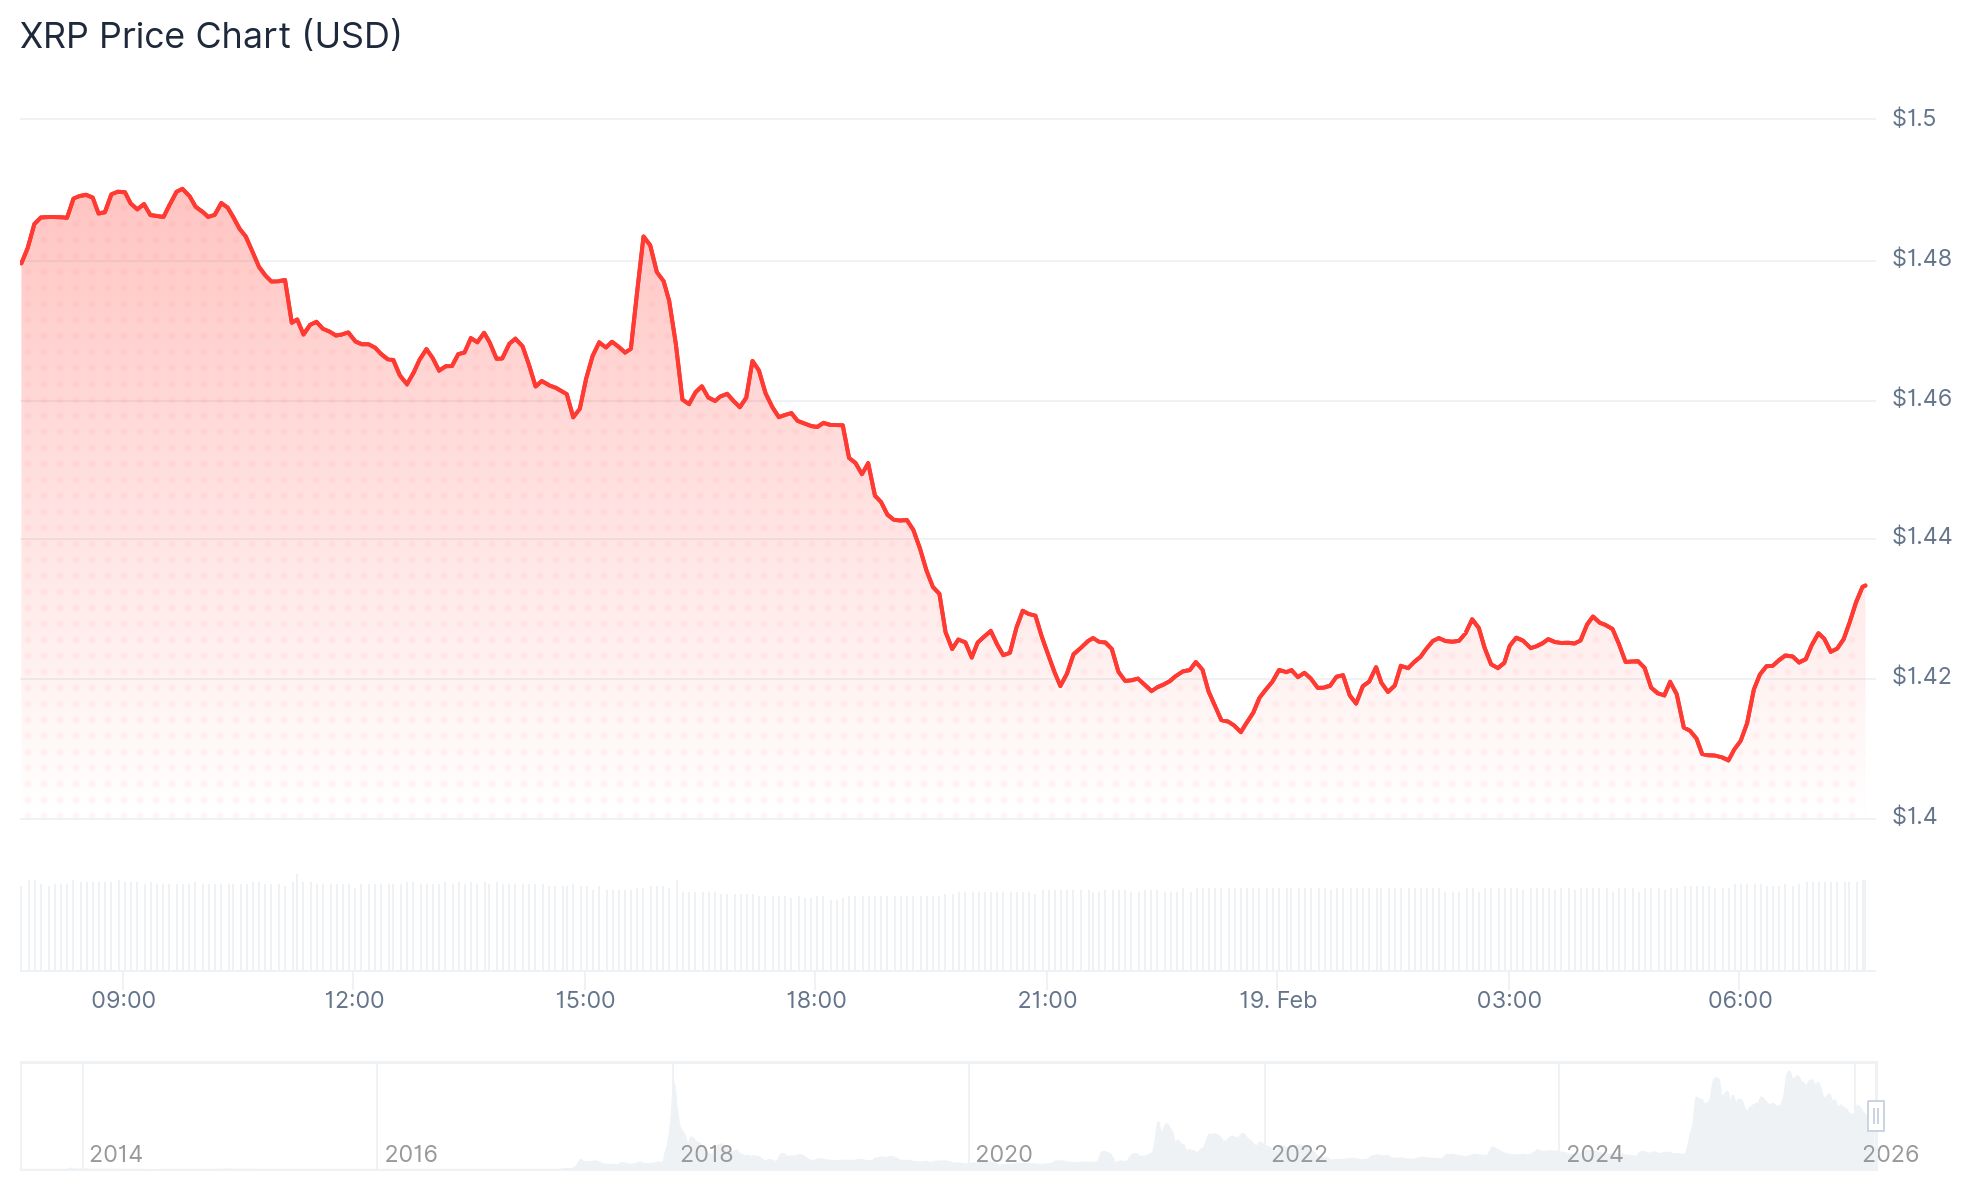
- XRP recovered from $1.11 and is now trading around $1.42, confirming a successful backtest of the breakout
- Fibonacci extension levels point to a $5 near-term target and an ultimate $19.40 target on the monthly chart
- Analysts identify the $1.30–$1.80 range as a historically underdeveloped zone that XRP may now be building a base in
XRP has been falling since it hit an all-time high of $3.66 in July 2025. Since that peak, the token has recorded six monthly red candles out of seven, dropping more than 61%.
The selling pressure intensified early this month. On February 5, 2026, XRP fell over 19% in a single day — its largest intraday drop since May 2021 — touching a 15-month low of $1.11.
That crash, while sharp, turned out to be technically meaningful.
XRP broke out of a multi-year symmetrical triangle in November 2024. That triangle had been forming since January 2018, when XRP fell from a high of $3.31. For nearly eight years, price made lower highs and lower lows inside that pattern.
BOOM💥💥 double bullish signal on #XRP
✓ 1M chart successful breakout & backtest just happened.
✓ From the high to the recent low fib extension suggests a 19.40$ price target.
You are not bullish enough even after watching this simple analysis🚀🚀 pic.twitter.com/MAPRErzjKq
— XRP CAPTAIN (@UniverseTwenty) February 9, 2026
The November 2024 breakout was triggered by a surge from $0.50 to above $2, which carried into 2025 and pushed XRP to its $3.66 all-time high.
The drop from that high back to $1.11 brought XRP exactly to the upper trendline of that same triangle — the level it broke above in late 2024.

Backtest Confirmed
According to market commentator XRP Captain, this retest of the $1.11 level confirmed the triangle breakout is holding. XRP bounced from that level and is now trading around $1.42.
A successful backtest of a breakout level is seen in technical analysis as confirmation that the move higher had genuine strength behind it.
From here, Fibonacci extension levels outline the next potential price targets. The 1.272 extension sits near $5, just above the previous all-time high of $3.66. The 2.618 extension sits at $19.40 — a level that would require a 1,266% rally from current prices.
The $1.30–$1.80 Zone
Analyst Austin_XRPL has pointed out a separate structural detail. Looking at XRP’s full price history, every major price zone has seen extended consolidation — except one.
What if XRP is simply building its final base…
Filling its final inefficient range…
Before it can finally enter expansion and never look back?
Look at the weekly structure.
Every major price zone in XRP history has built a base:
$0.15–$0.30 → 2 years of price action… pic.twitter.com/QUO1EhShX3
— Austin (@Austin_XRPL) February 17, 2026
The $1.30 to $1.80 range was passed through quickly during prior rallies, leaving little trading history or established support.
Austin describes this as an inefficient range. Recent weekly price action shows XRP trading within this corridor, which he interprets as the market filling in that gap and building a base.
XRP is currently trading at $1.42, inside that range.


