


TLDR
- XRP is trading at $2.42 after reclaiming the $2.40 Point of Control level following a volatile week with price swings between $2.21 and $2.64
- Open interest on derivatives exchanges has rebounded to historical levels after July liquidation events, indicating renewed trader confidence
- The token ranks fifth on CoinMarketCap with a $145.25 billion market cap and recorded $5.13 billion in 24-hour trading volume
- Key technical levels include resistance at $2.48 and support at $2.40, with potential upside targets at $2.64 and $2.70
- XRP is consolidating within a rising channel with the RSI at 46, suggesting the market is waiting for a directional breakout
XRP is currently trading at $2.42 after a week of high volatility that saw the token swing between $2.21 and $2.64. The price represents a 1.37% decline on the day.
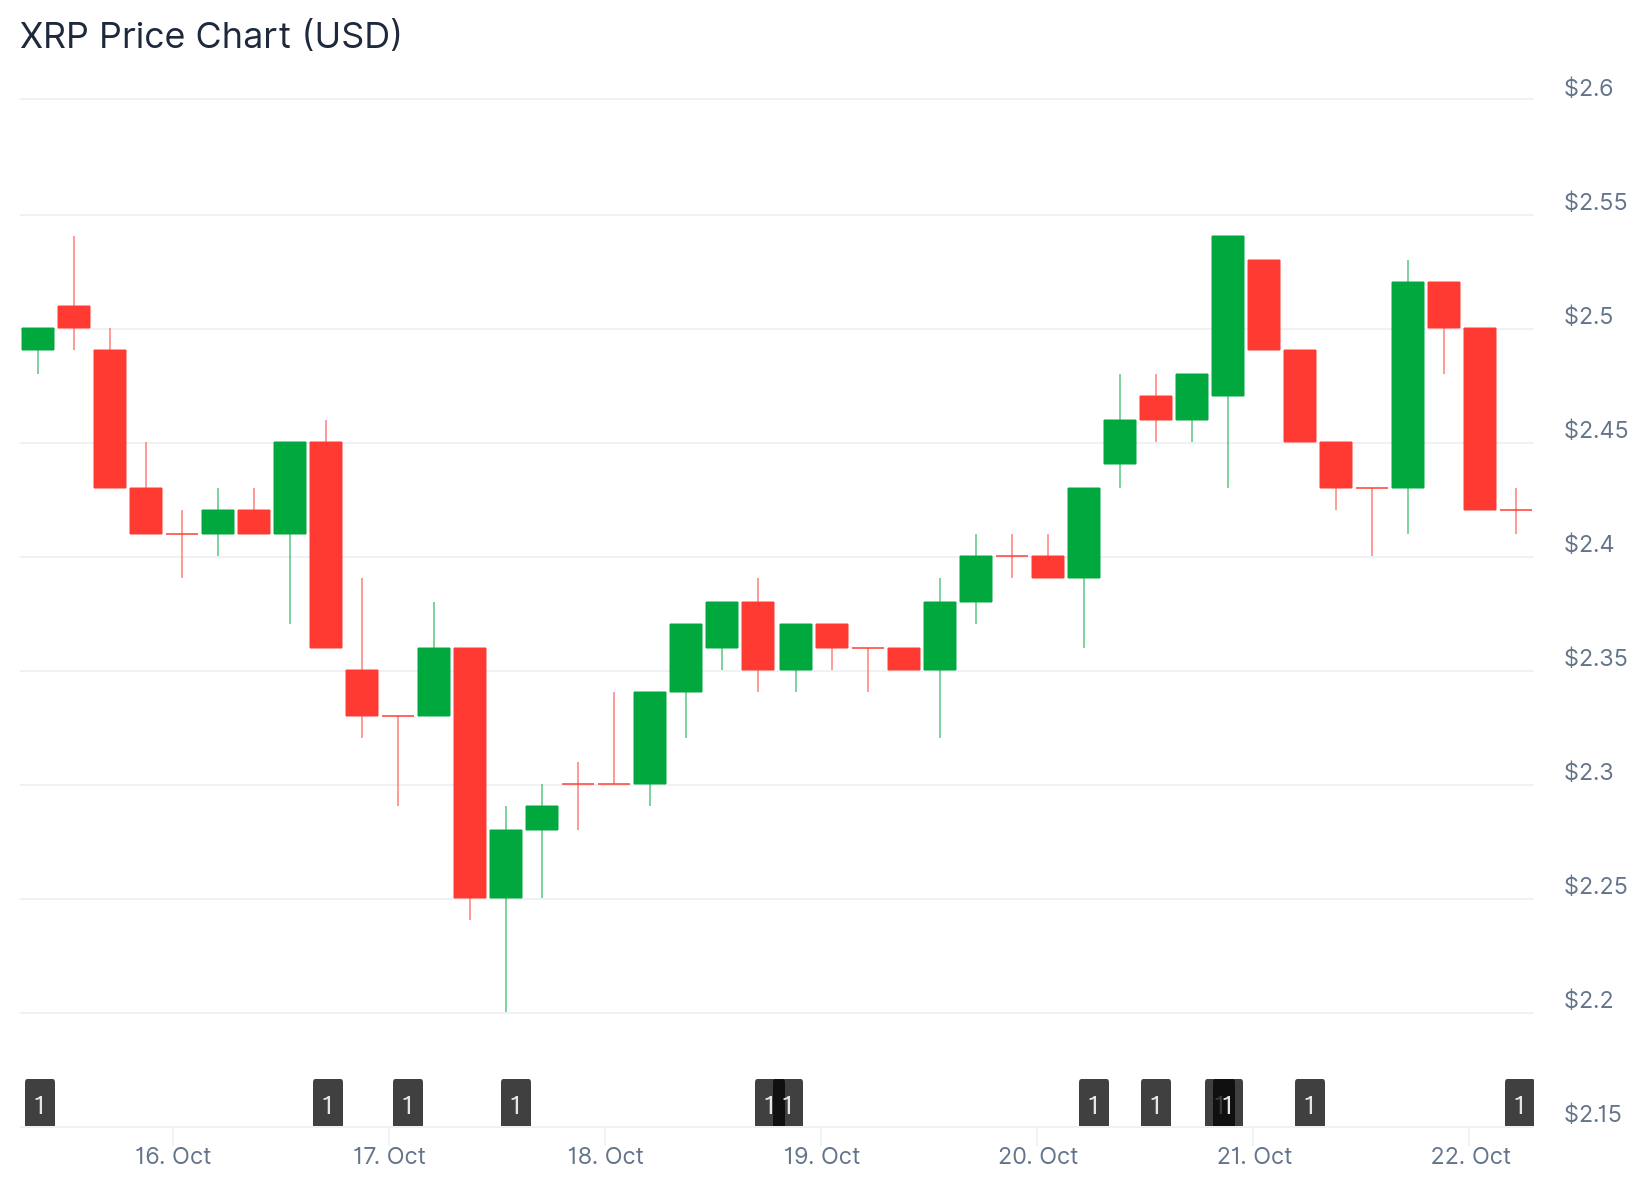
The token has reclaimed the $2.40 level, which represents a key Point of Control based on volume data. This price area has emerged as a critical technical level where the market is showing resilience.
XRP ranks fifth on CoinMarketCap with a market capitalization of $145.25 billion. The token recorded $5.13 billion in 24-hour trading volume.
The recent retest of the value area low confirmed strong underlying demand. Buyers stepped in early, preventing a deeper retracement and reinforcing $2.40 as a structural support level.
Price is currently consolidating inside a rising channel pattern. This formation suggests traders are waiting for a clear signal about the next directional move.
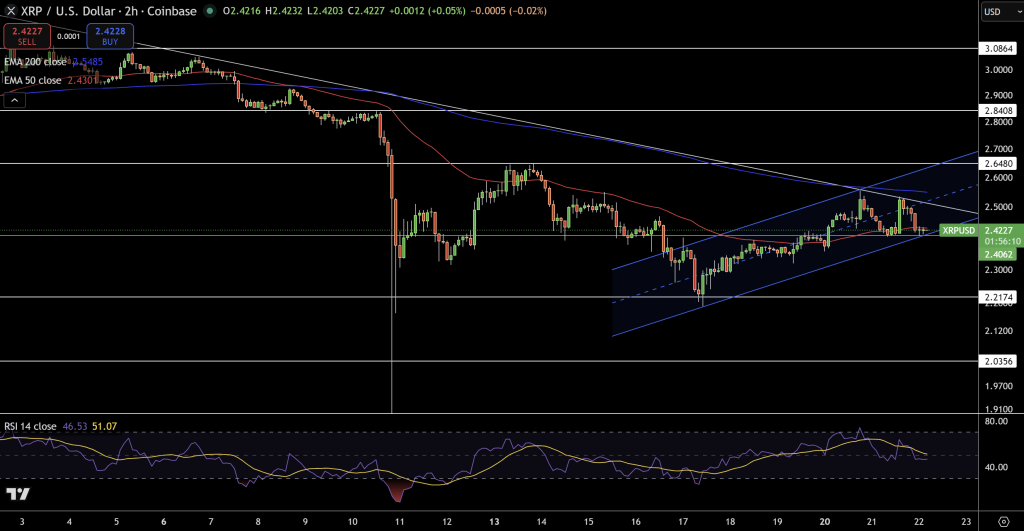
The steady formation of higher lows indicates underlying support from buyers. However, momentum has slowed as the price hovers near the channel’s midline.
Key Technical Levels
XRP is trading between two major moving averages. The 50-day EMA sits around $2.43 while the 200-day EMA is positioned near $2.54.

This positioning creates a standoff between short-term profit-takers and long-term holders. The RSI indicator stands at 46, showing a slightly bearish lean but remaining relatively neutral.
Doji and spinning top candlestick patterns are forming on the chart. These patterns typically indicate market indecision as participants await a breakout or breakdown before committing to new positions.
The trendline that began in early October continues to act as a major resistance point. Volume confirmation will be important for validating any upward movement.
Open Interest Recovery
Open interest across major futures exchanges has rebounded following a sharp reset in July. Liquidation events during that period wiped out excessive leverage from the market.
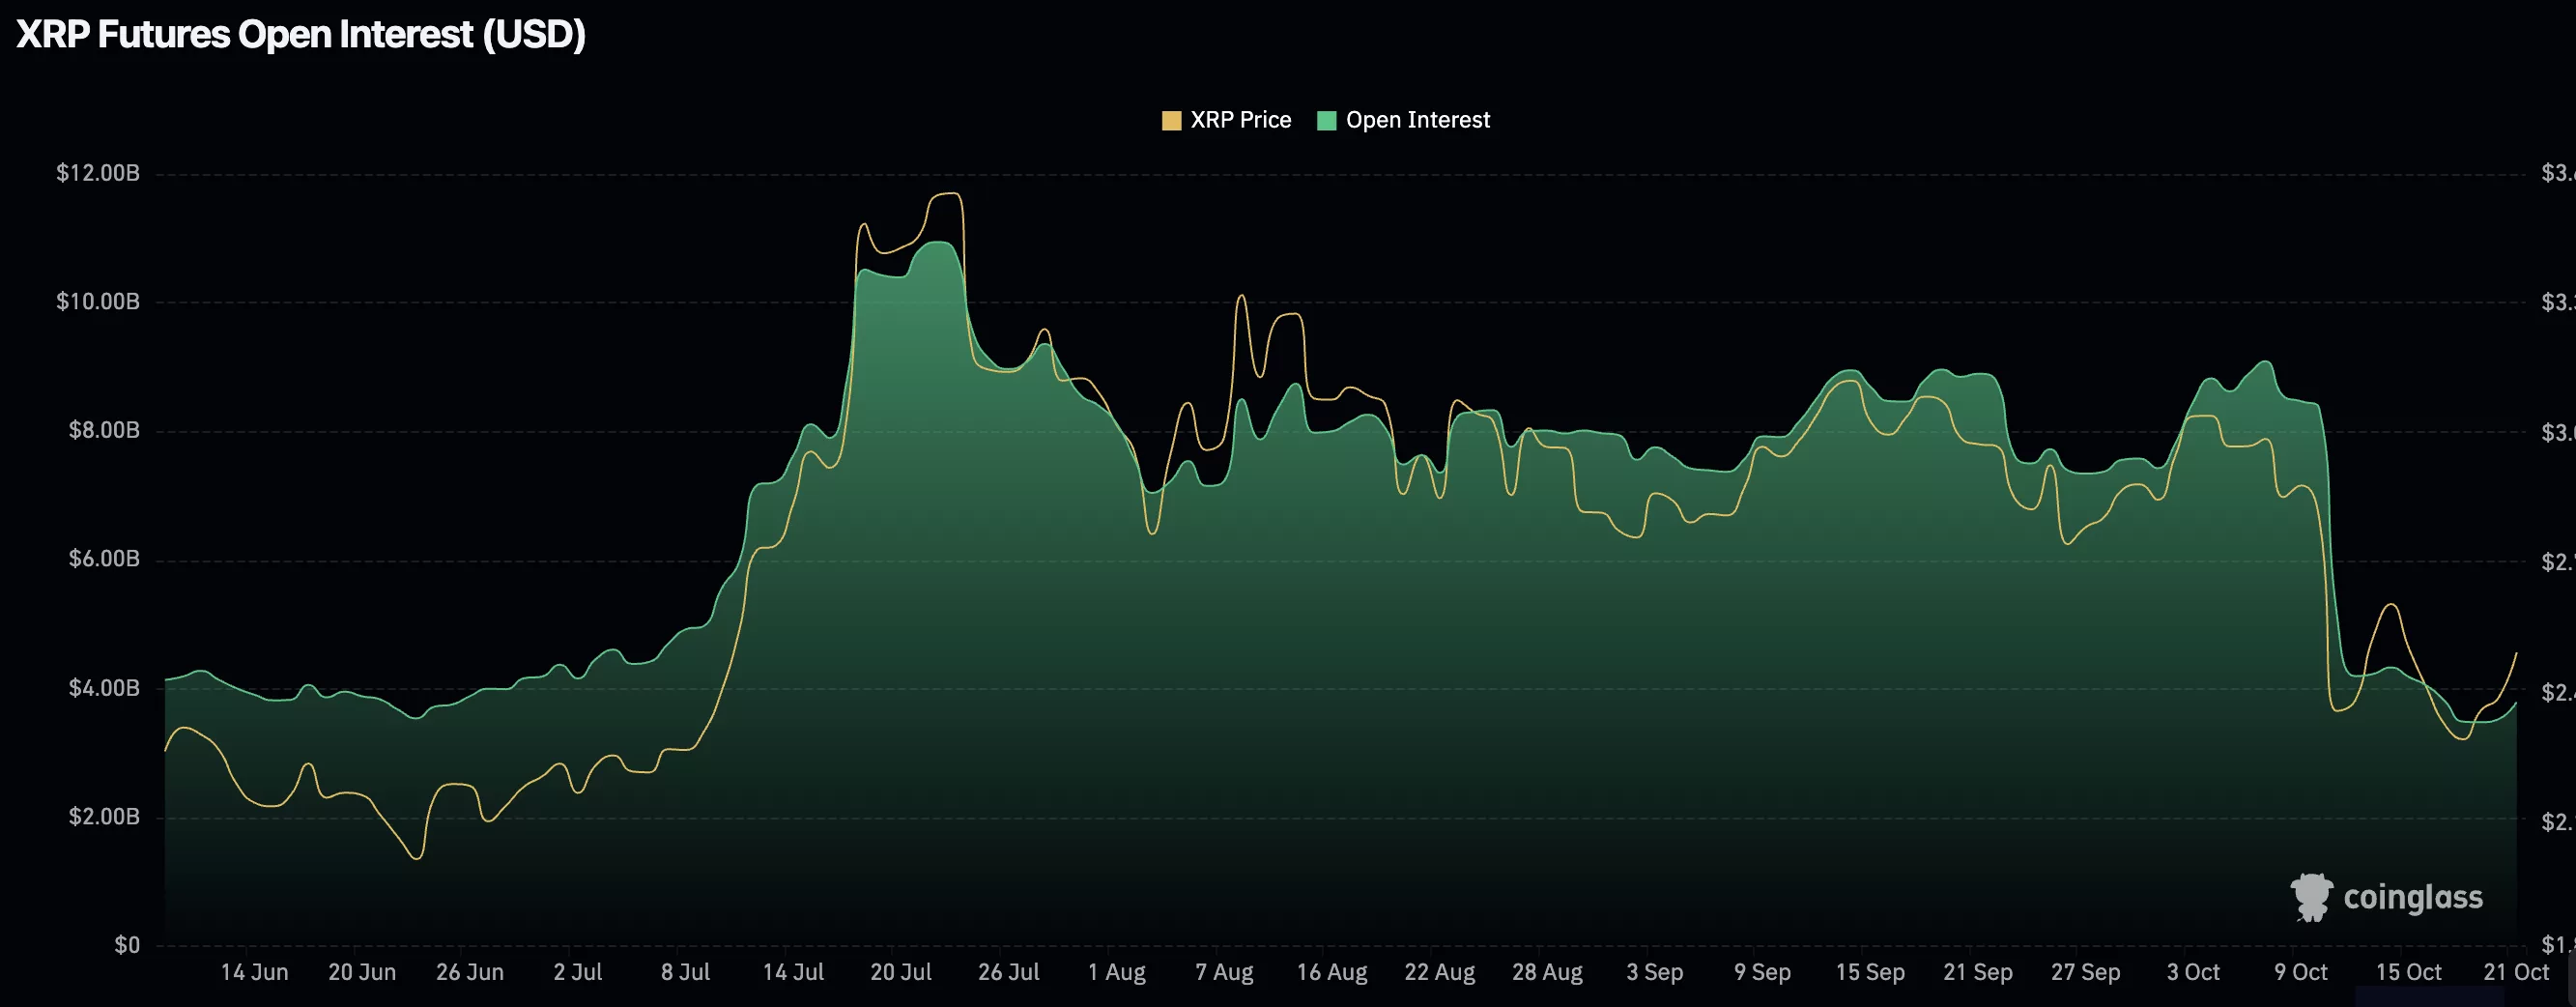
Open interest is now rising again alongside price. This combination indicates traders are re-entering the market with renewed confidence rather than speculative overexposure.
If open interest continues to climb while price consolidates above $2.40, it will confirm that new long positions are being established. This behavior has historically preceded continuation rallies when supported by stable funding rates and rising spot volume.
The recovery in derivatives data represents a key factor supporting the current price structure. Traders are showing renewed interest after the July liquidation cycle cleared out overleveraged positions.
Price Scenarios
If XRP breaks above $2.48, renewed buying momentum could push the price toward $2.64 or $2.70. These moves would be supported by the upper channel boundary.
A close below $2.40 would weaken the current structure. The next support levels would come into play near $2.21, a psychological threshold where buyers may re-emerge.
The buy zone for traders sits between $2.40 and $2.45, with confirmation needed above $2.48. Potential targets are set at $2.64 and $2.70, with a stop loss below $2.37.
As long as XRP maintains daily closes above $2.40, the structure remains intact. The token’s ability to defend this level will determine whether the recent reclaim leads to further upside.


