


TLDR
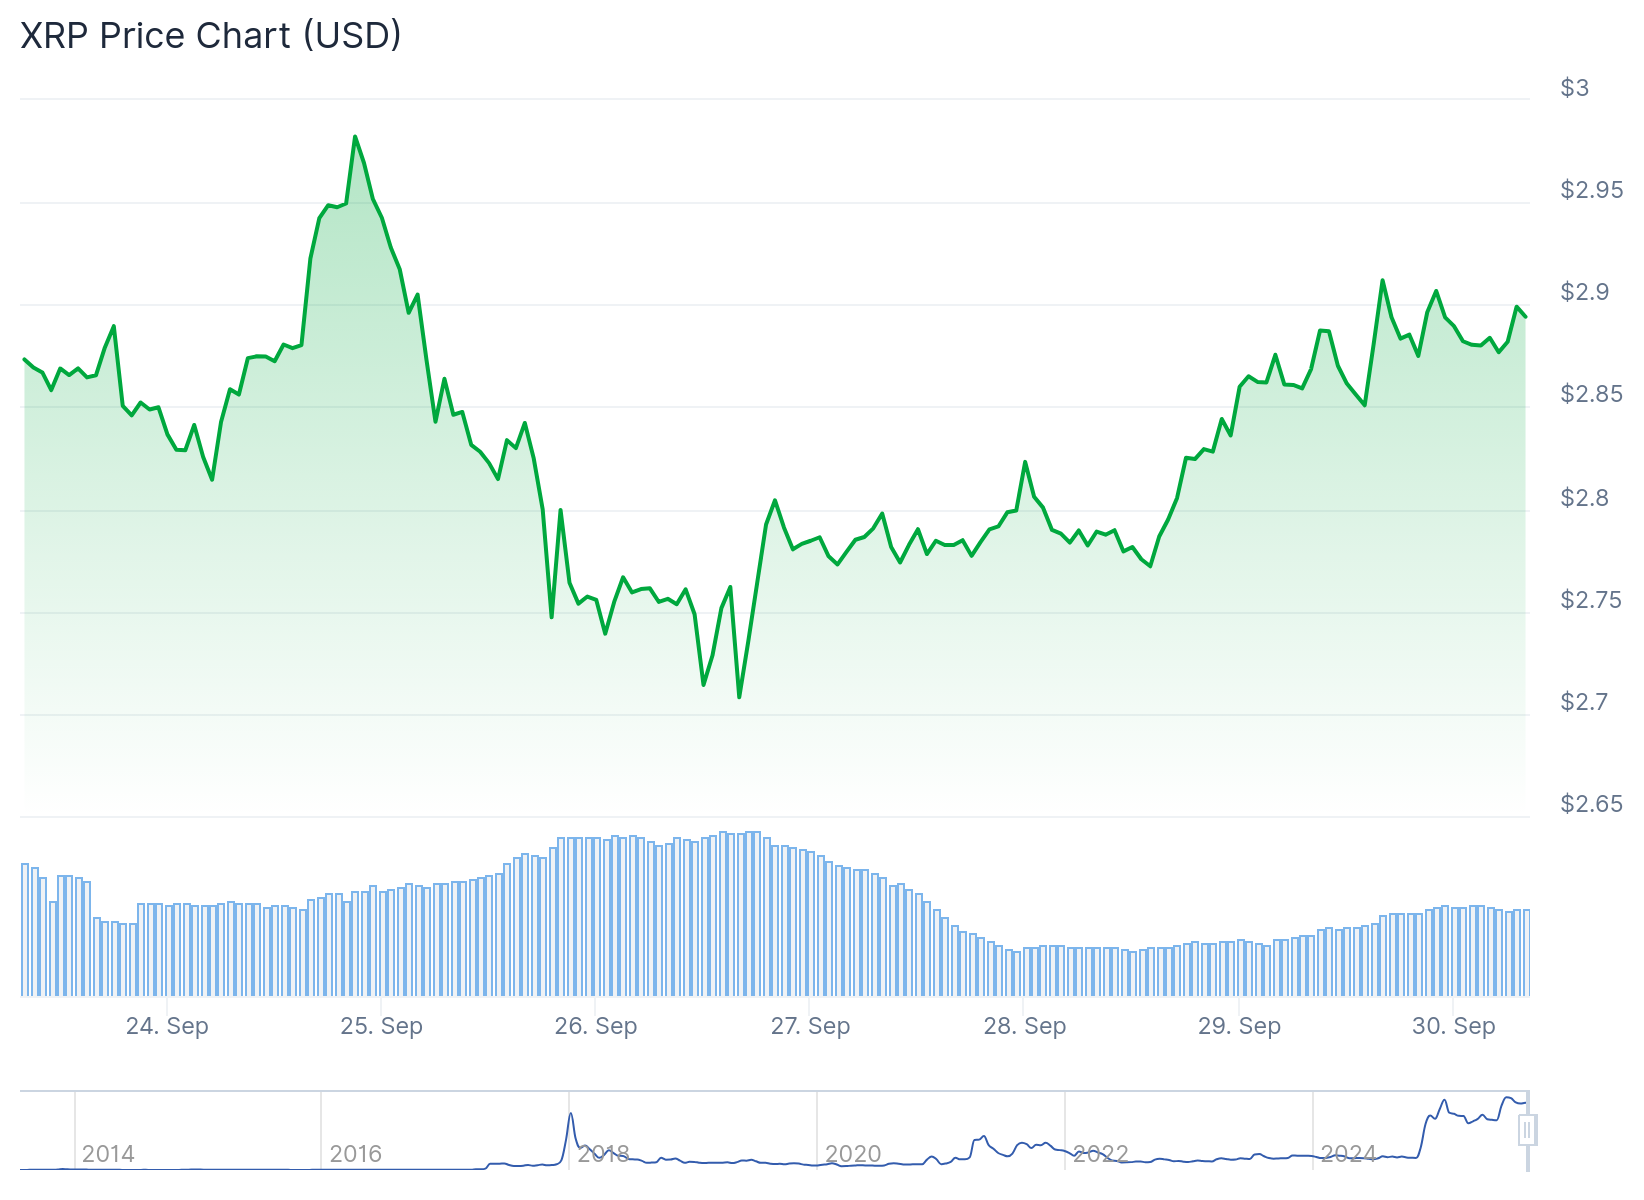
- XRP is currently trading at $2.89, up 3.89%, with a market cap of $173.33 billion and daily trading volume of $4.5 billion
- The price sits within a descending channel pattern similar to July 2025, when XRP rallied 66% after breaking out
- Technical analysis suggests a potential 35% rally to $4 if XRP breaks above current resistance at $2.91
- The SEC will decide on six spot XRP ETF applications throughout October 2025, with decisions scheduled between October 18-25
- Price predictions estimate XRP could reach an average of $3.36 by December 2025, though breaking $3 depends on multiple factors
XRP is trading at $2.89 as of September 30, 2025. The token has gained 3.89% in recent trading sessions. Daily volume stands at $4.5 billion with a market cap of $173.33 billion.
The current price action shows XRP testing a descending channel pattern. This setup looks similar to the pattern seen in July 2025. That earlier formation led to a 66% price rally.
Technical indicators paint a mixed picture for the token. The moving average line sits above current price candles, suggesting bearish pressure. However, the MACD indicator shows the blue line above the orange signal line, pointing to bullish momentum.
Resistance sits at $2.91 according to TradingView data. If XRP pushes past this level, the next target is $2.95. Support holds at $2.83, with a deeper support zone at $2.75.
ETF Decisions Line Up Through October
The SEC has six spot XRP ETF applications to review this month. The first decision comes October 18 for the Grayscale XRP ETF.
The 21Shares Core XRP Trust follows on October 19. The Bitwise XRP ETF decision is scheduled for October 20.
Canary Capital’s XRP ETF faces review on October 23. The final October decision covers the WisdomTree XRP ETF on October 25.

Each of these decisions could affect XRP’s price movement. Approvals might bring new institutional money into the market. Rejections could create selling pressure.
The timing aligns with XRP’s technical setup. The token sits near the upper boundary of its descending channel. A breakout could trigger the same type of movement seen in July.
Price Targets Based on Technical Patterns
Fibonacci extension levels show potential upside targets if XRP breaks out. The 1.618 level points to $3.48. The 2.618 level suggests $3.97 is possible.
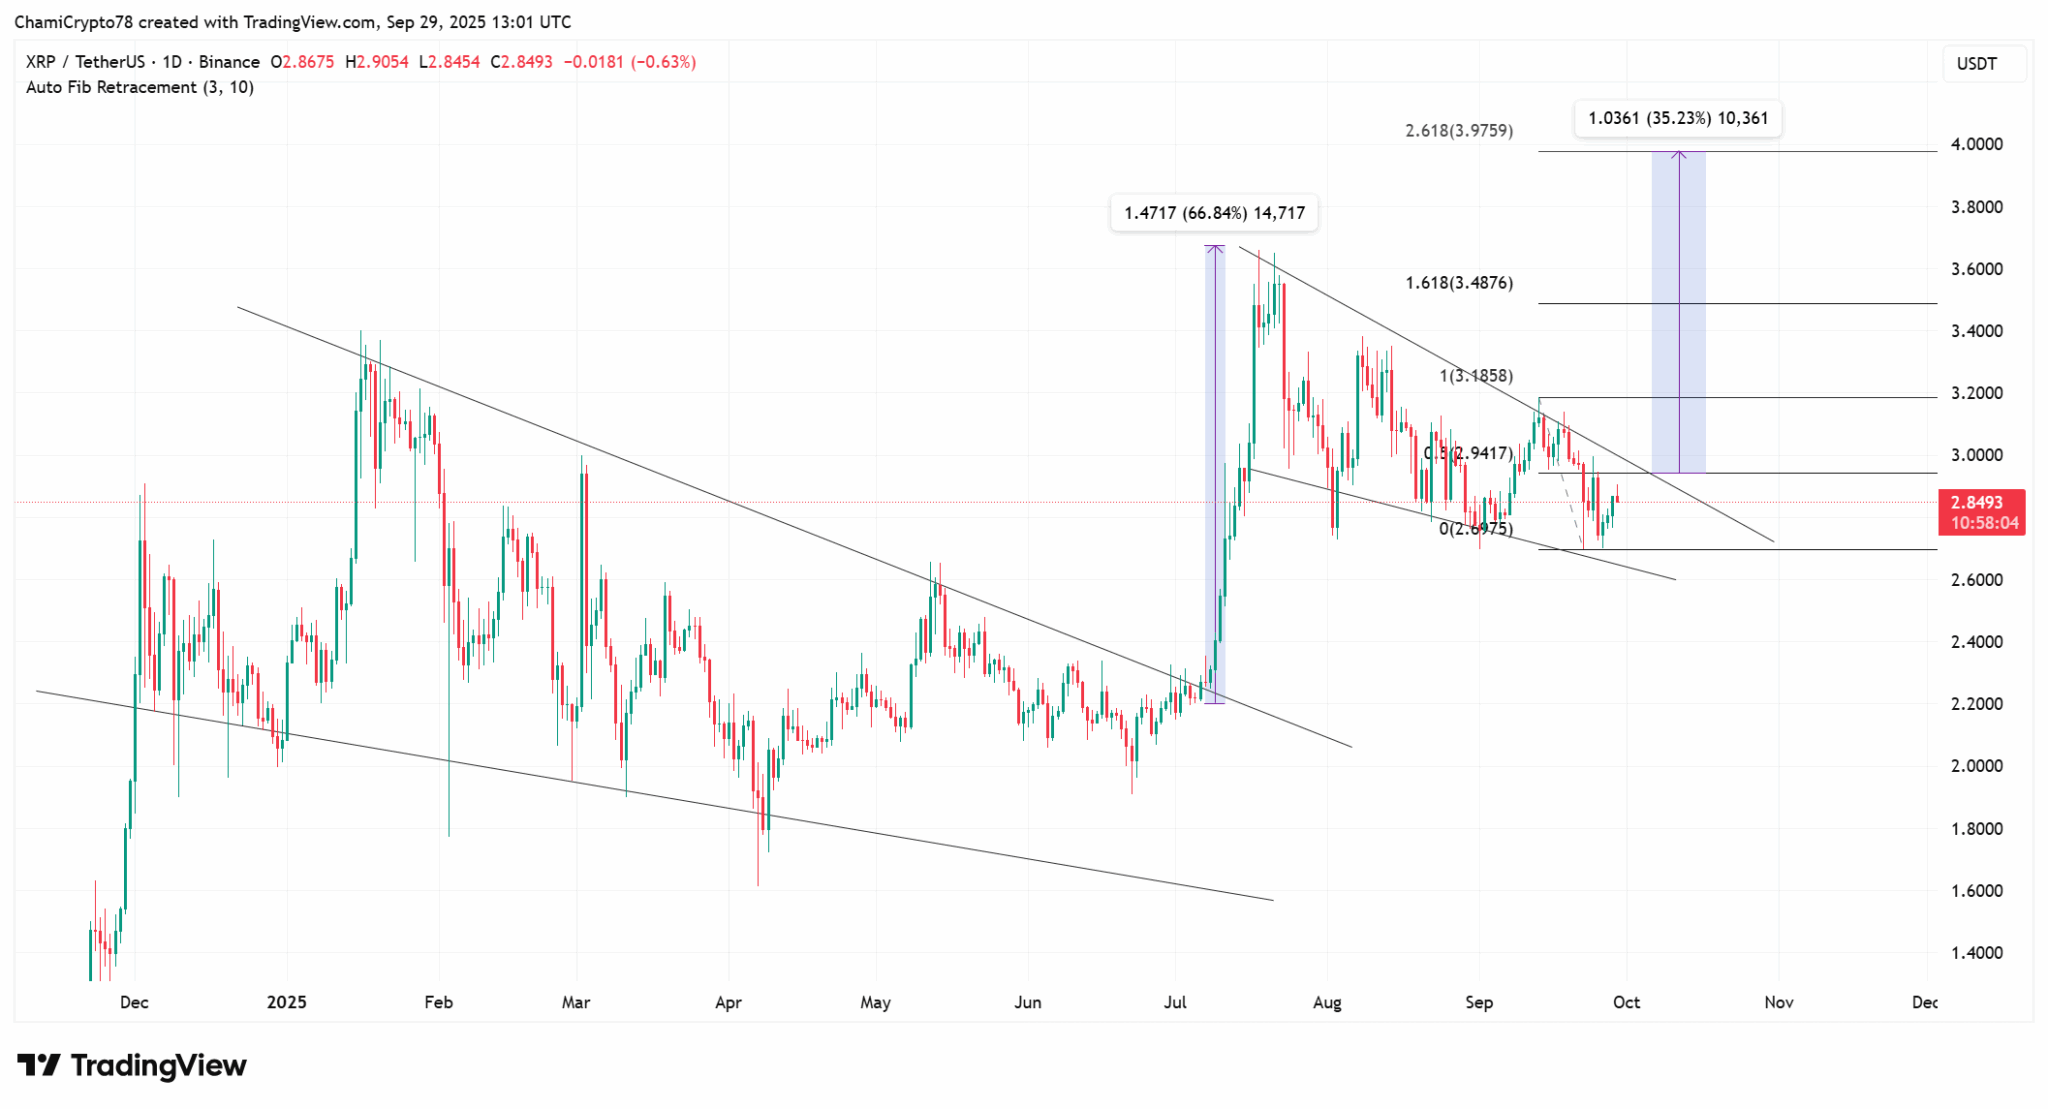
Current chart patterns suggest a 35% rally from present levels. This projection puts the target at $4 by the end of October.
CoinCodex data estimates different figures for December 2025. Their analysis shows an average price of $3.36 for the final month of the year. The maximum price in their model also reaches $3.36. This represents a potential return of 16.03% from current levels.

The $3 price level remains a key psychological barrier. XRP has approached this level multiple times in 2025. Breaking through would require sustained buying pressure.
Banks and financial institutions continue watching Ripple’s cross-border payment technology. This institutional interest provides a fundamental backdrop to price movements.
Market conditions will play a role in whether XRP reaches these targets. Factors include overall crypto market sentiment, adoption rates, and macroeconomic conditions. The SEC ETF decisions in October represent the most immediate catalyst on the calendar.


