


TLDR
- XRP’s price falls by 4.7% as $130 million in sell-offs occur this week.
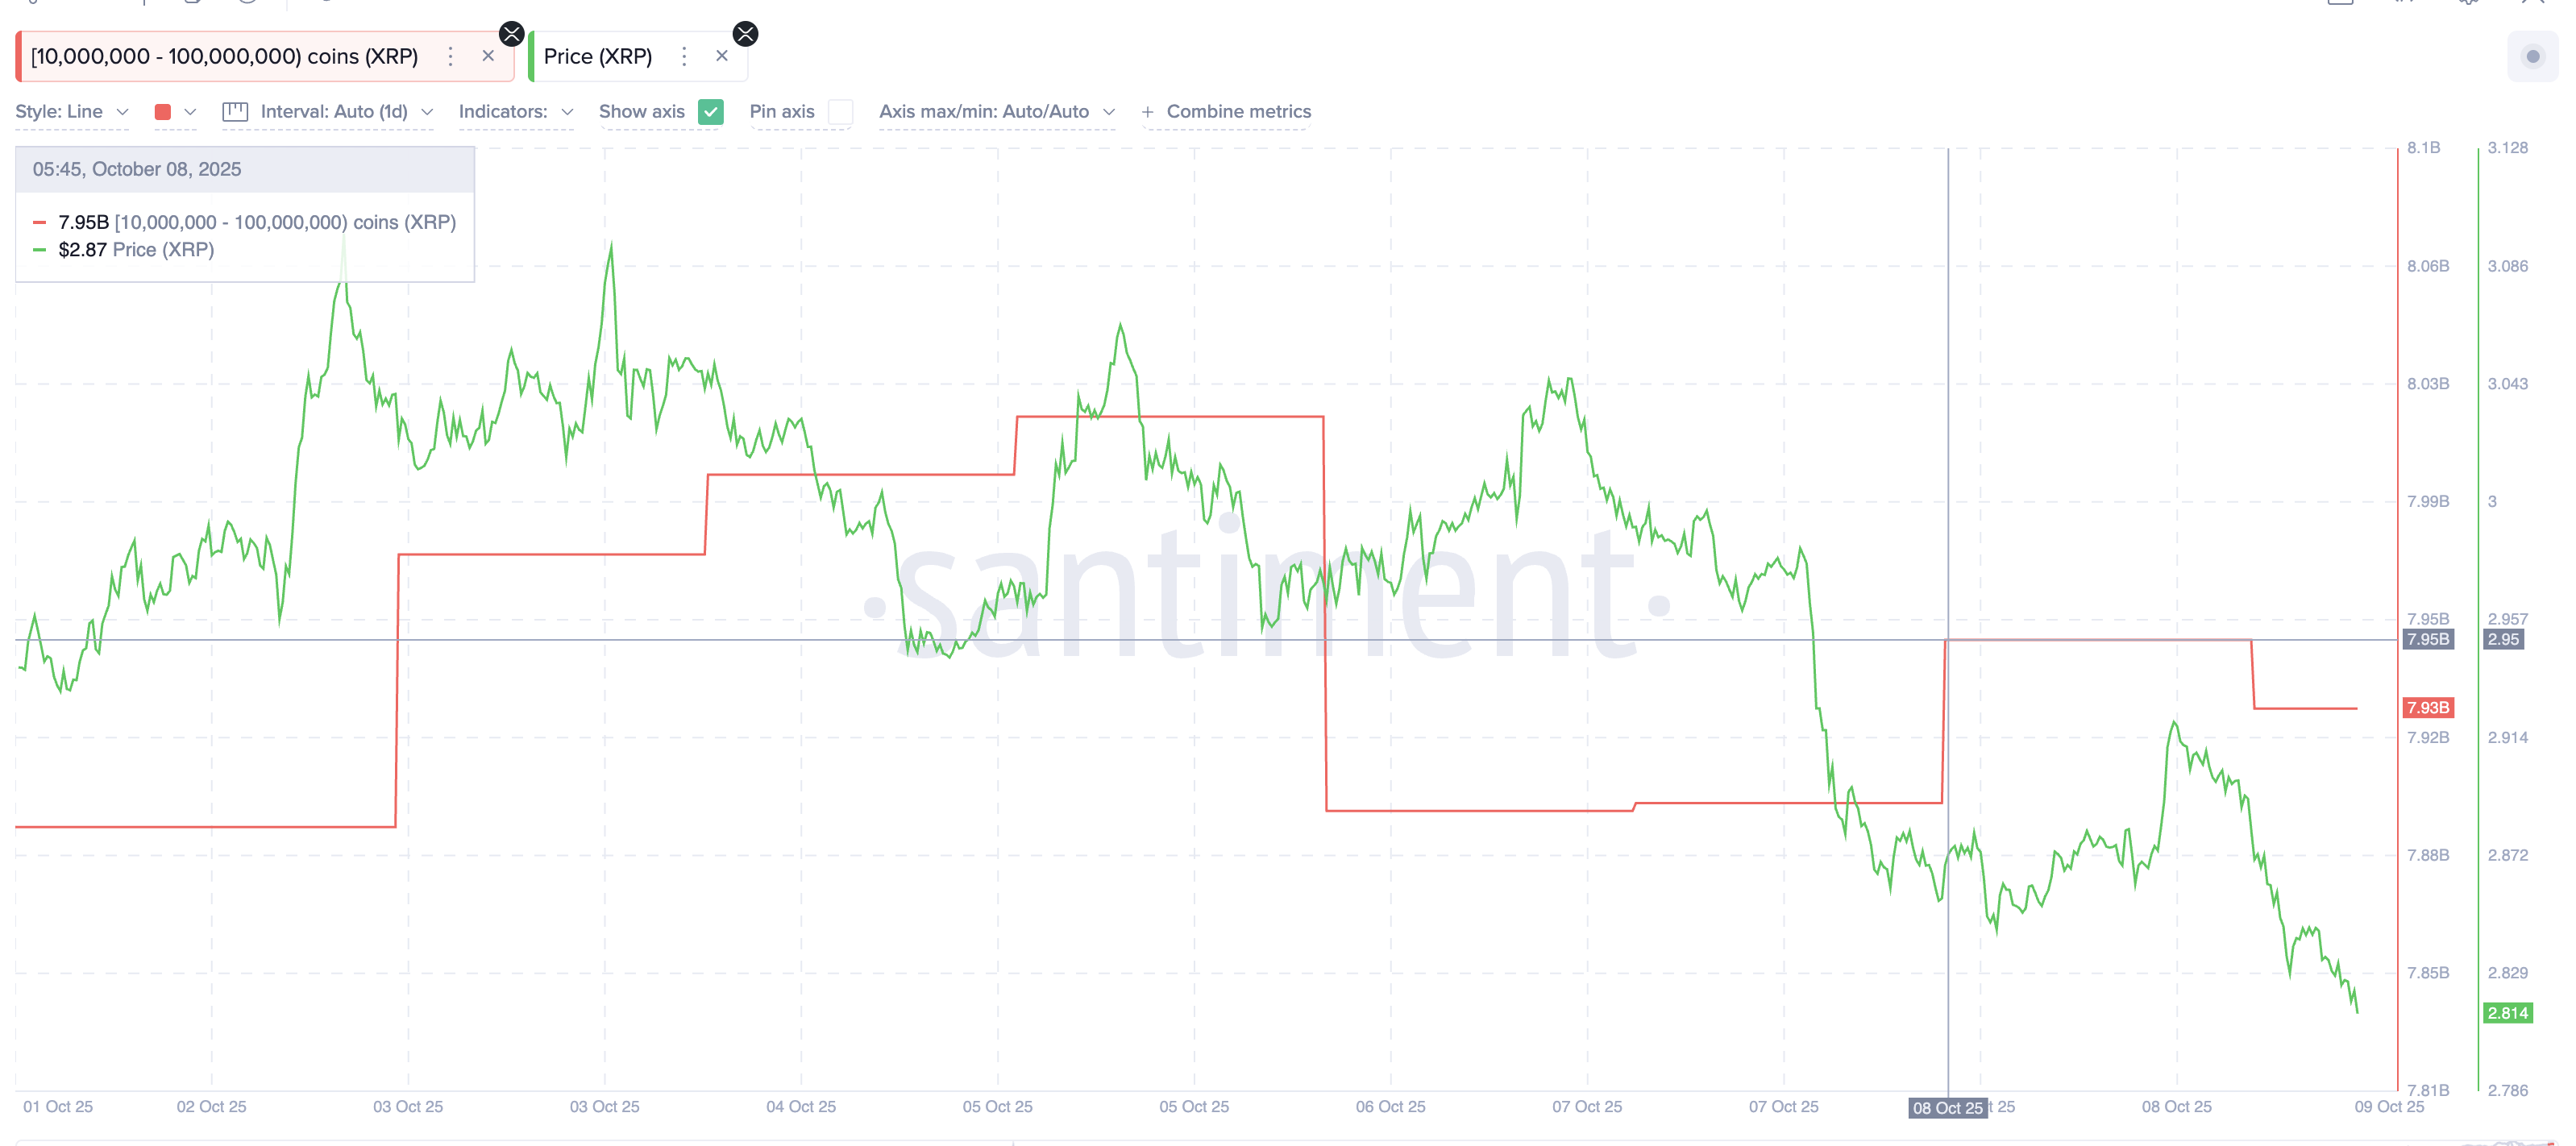
- Whales holding 10M-100M XRP tokens sold 20M tokens worth $56M.
- Long-term holders trimmed 25.89M XRP worth $72.5M since early October.
- Hidden bullish divergence on the 12-hour chart suggests a potential price rebound.
XRP’s price has experienced a sharp decline this week, dropping nearly 4.7% amid significant sell-offs from large holders and long-term investors. With the price hovering around $2.80, the selling pressure has intensified. However, a key chart pattern has emerged, hinting that a potential reversal could be on the horizon if certain conditions are met. Despite the bearish trend, XRP could be at a crucial point for recovery.
Major Selling Activity Drives Price Down
The recent drop in XRP’s price can be attributed to a wave of selling activity from whales and long-term holders. Data reveals that XRP wallets holding between 10 million and 100 million tokens have reduced their supply by approximately $56 million in just 24 hours. This reduction, amounting to about 20 million tokens, has added considerable selling pressure to the market.
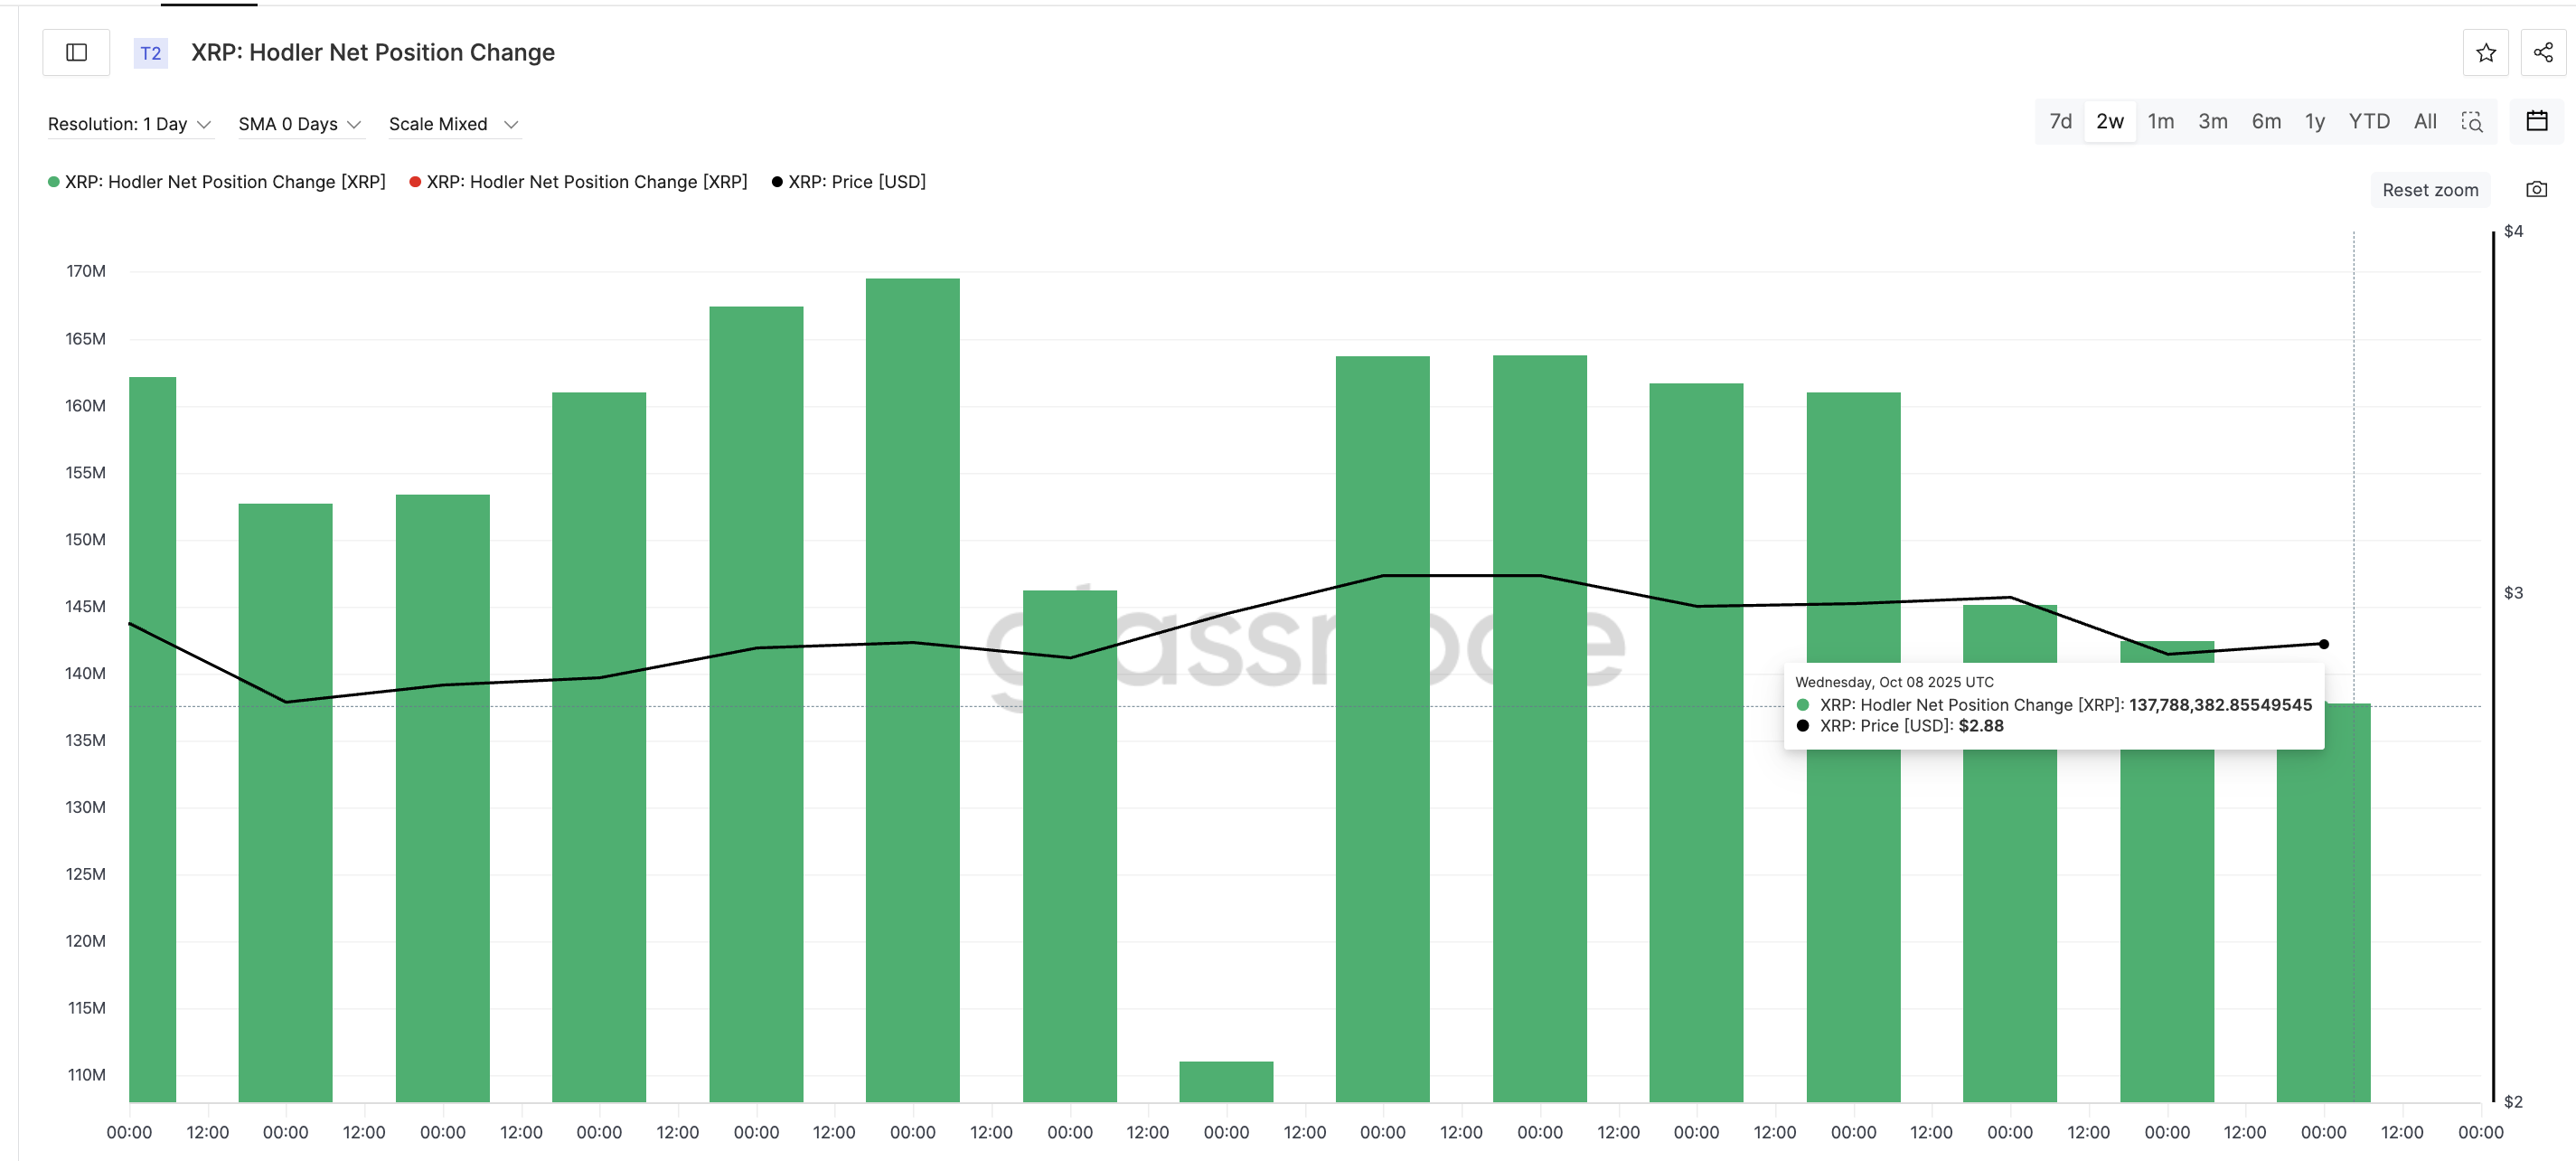
Long-term holders have also contributed to the decline, trimming their positions by nearly $72.5 million since early October. On-chain data shows that these holders have reduced their holdings from 163.68 million XRP to 137.78 million XRP. Combined, the selling activity from both groups totals roughly $130 million in less than a week, contributing directly to the 4.7% decline in XRP’s price this week.
Descending Triangle Signals Bearish Sentiment
Technically, XRP continues to trade below a descending trendline, forming a descending triangle pattern on the 12-hour chart. This structure generally suggests growing bearish pressure, as it indicates a series of lower highs with a flat support level. Such patterns are typically seen as a sign of potential further price declines, especially when the price tests key support levels.
Despite the prevailing bearish trend, there is a potential signal for a recovery. The descending triangle is not the only factor influencing XRP’s movement, as the chart also shows some subtle signs that suggest a potential reversal if certain conditions hold. Traders and analysts are now closely monitoring the price action to see if XRP can maintain crucial support levels.

Hidden Bullish Divergence Offers Hope
Amidst the selling pressure, a hidden bullish divergence has appeared on the 12-hour chart. This technical pattern occurs when the price forms higher lows while the Relative Strength Index (RSI) prints lower lows. Typically, a hidden bullish divergence indicates that selling pressure is easing, which could set the stage for an upward price movement if the support level is maintained.
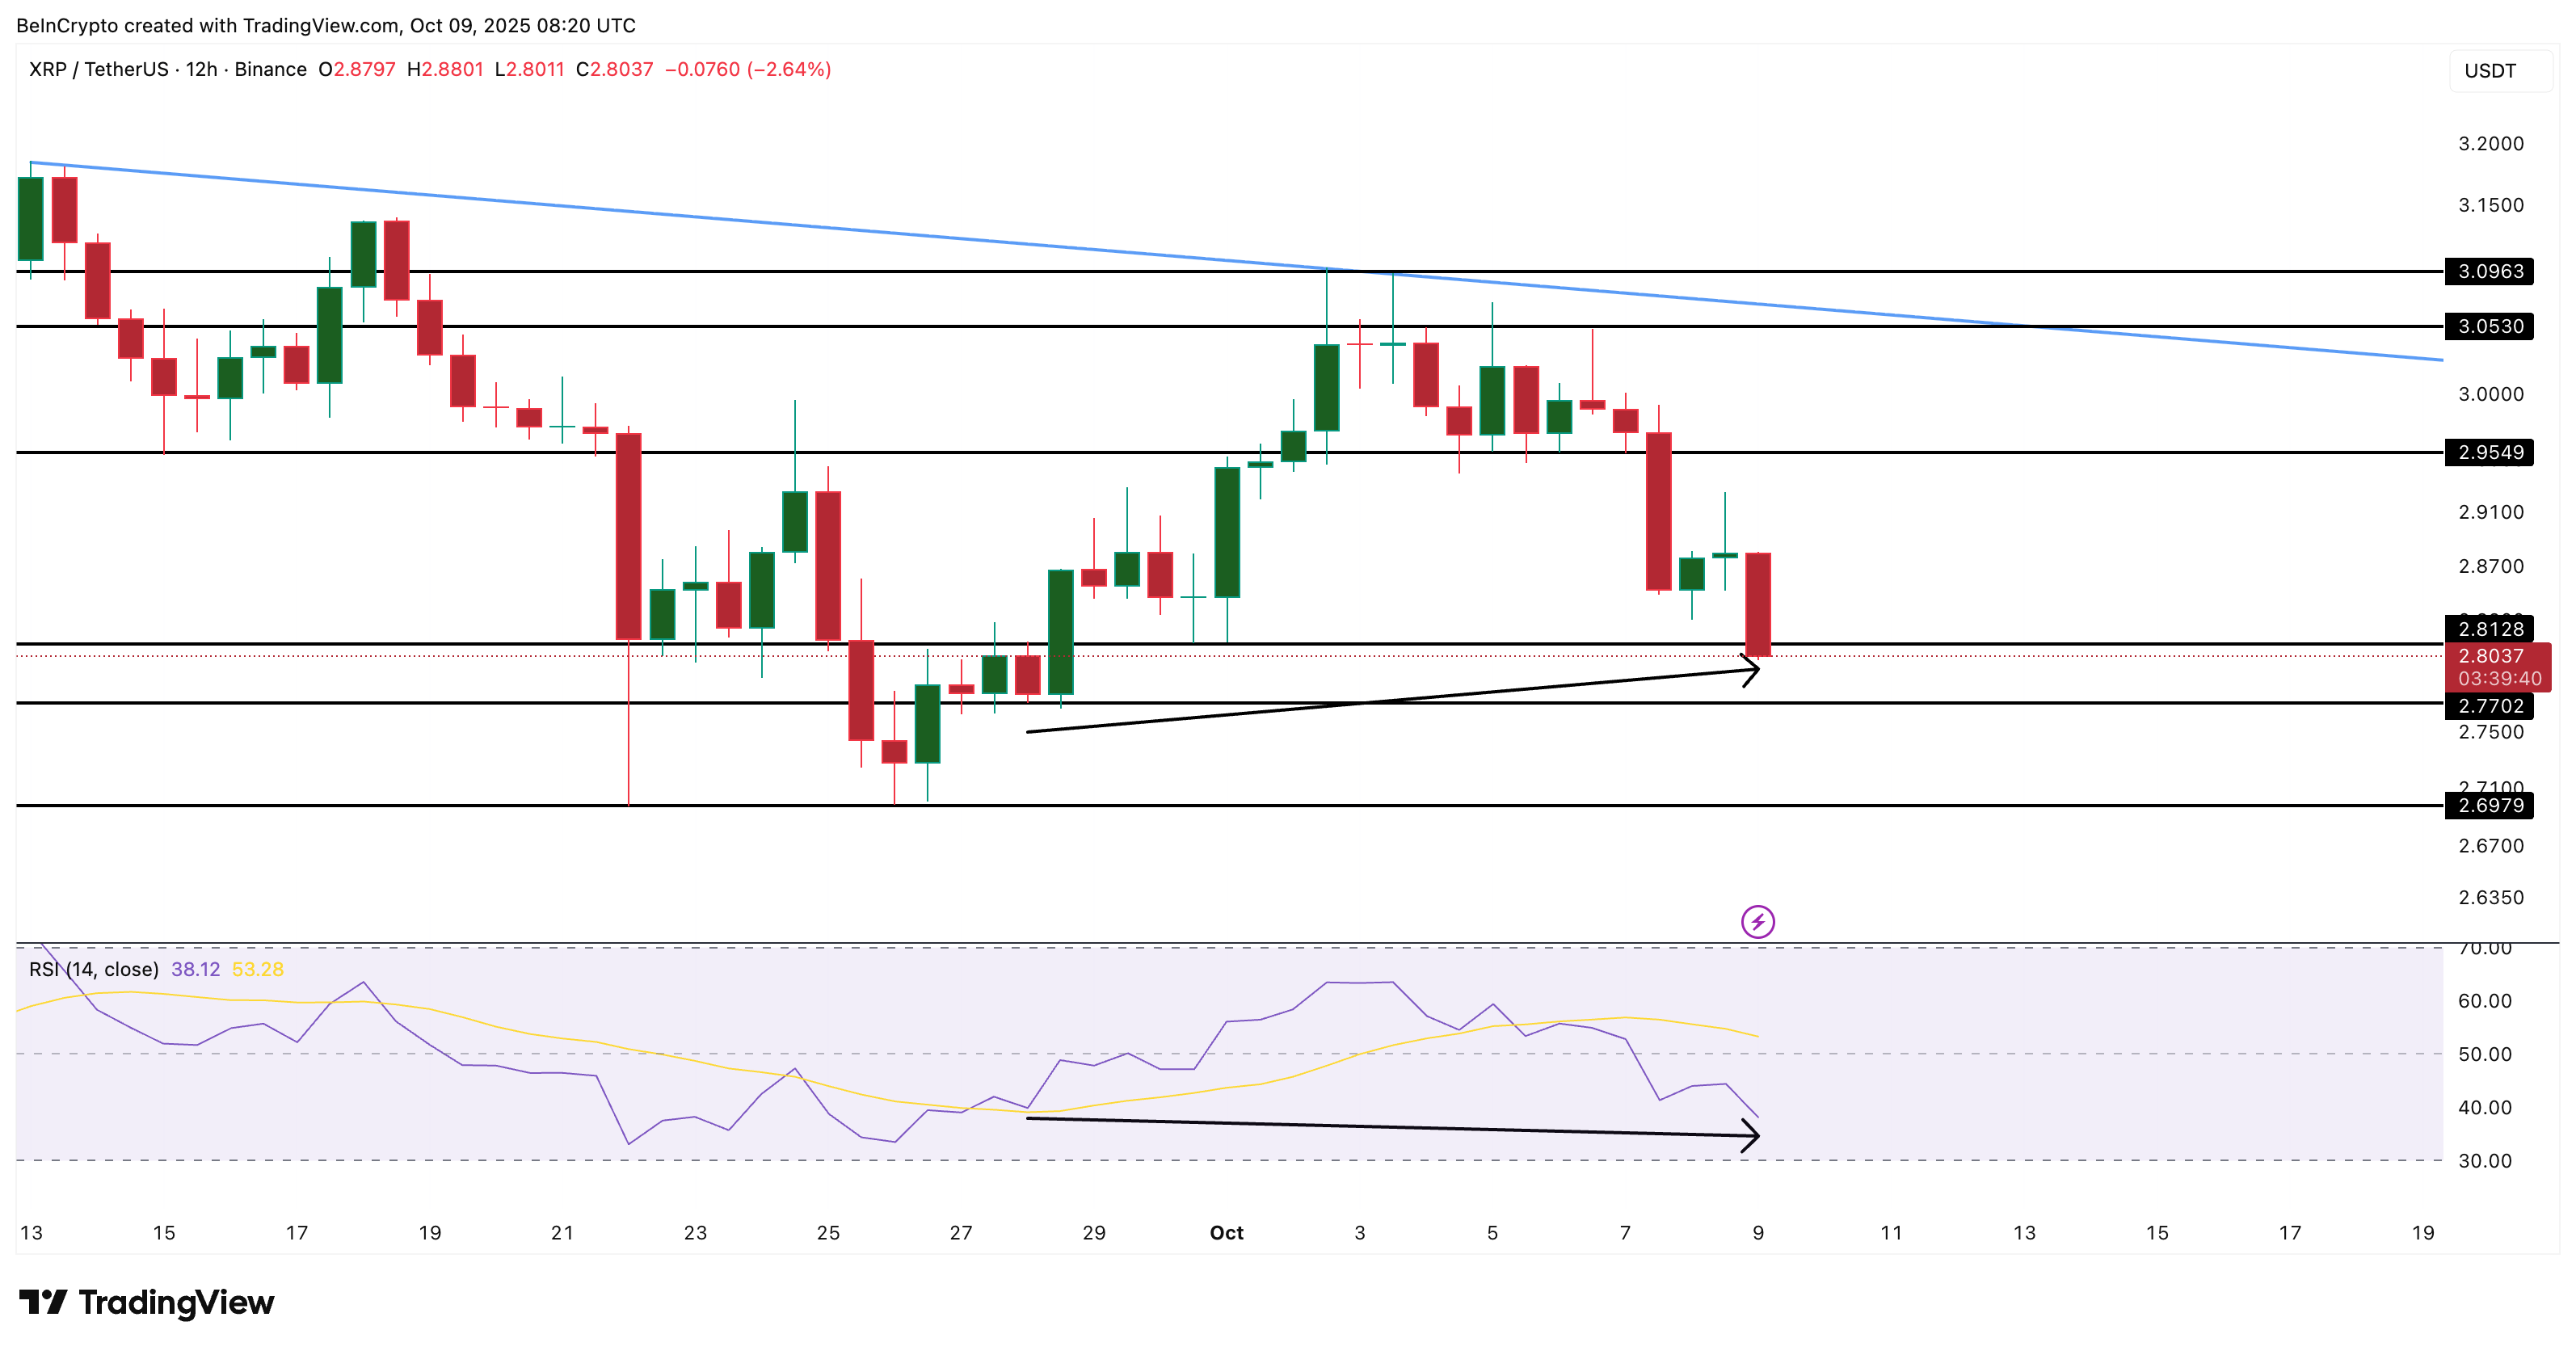
For this divergence to be confirmed, XRP must hold above the $2.77 level, the low reached on September 27. If the price manages to stay above this level, it could validate the divergence and set the stage for a potential price recovery. Key resistance levels to watch for would be $2.95 and $3.09, both of which have previously acted as rejection points during past rallies.
Key Support Level to Watch
The $2.77 level is now a critical support for XRP. If the price fails to hold above this mark, the hidden bullish divergence will likely be invalidated, and further price declines could follow. A break below $2.77 could push XRP toward the next support zone at $2.69 or even lower, signaling further weakness in the market.
XRP is currently facing significant selling pressure, with whales and long-term holders offloading considerable amounts of the token. Despite this, a hidden bullish divergence on the chart offers a glimmer of hope for a potential rebound. For a recovery to take place, XRP needs to maintain support at $2.77 and overcome key resistance levels in the coming days.


