


TLDR
- XRP is trading around $1.30–$1.32, down 4.7% in 24 hours and 30% over the past month
- The token has retraced 62% from its July 2025 all-time high of $3.65
- On-chain realized losses hit their highest spike in 39 months, last seen in 2022
- Trading volume surged 72% to $2.35 billion, with futures volume up 39% to $4.02 billion
- Key support sits at $1.30; a daily close below that level could expose $1.20 and then $1.00
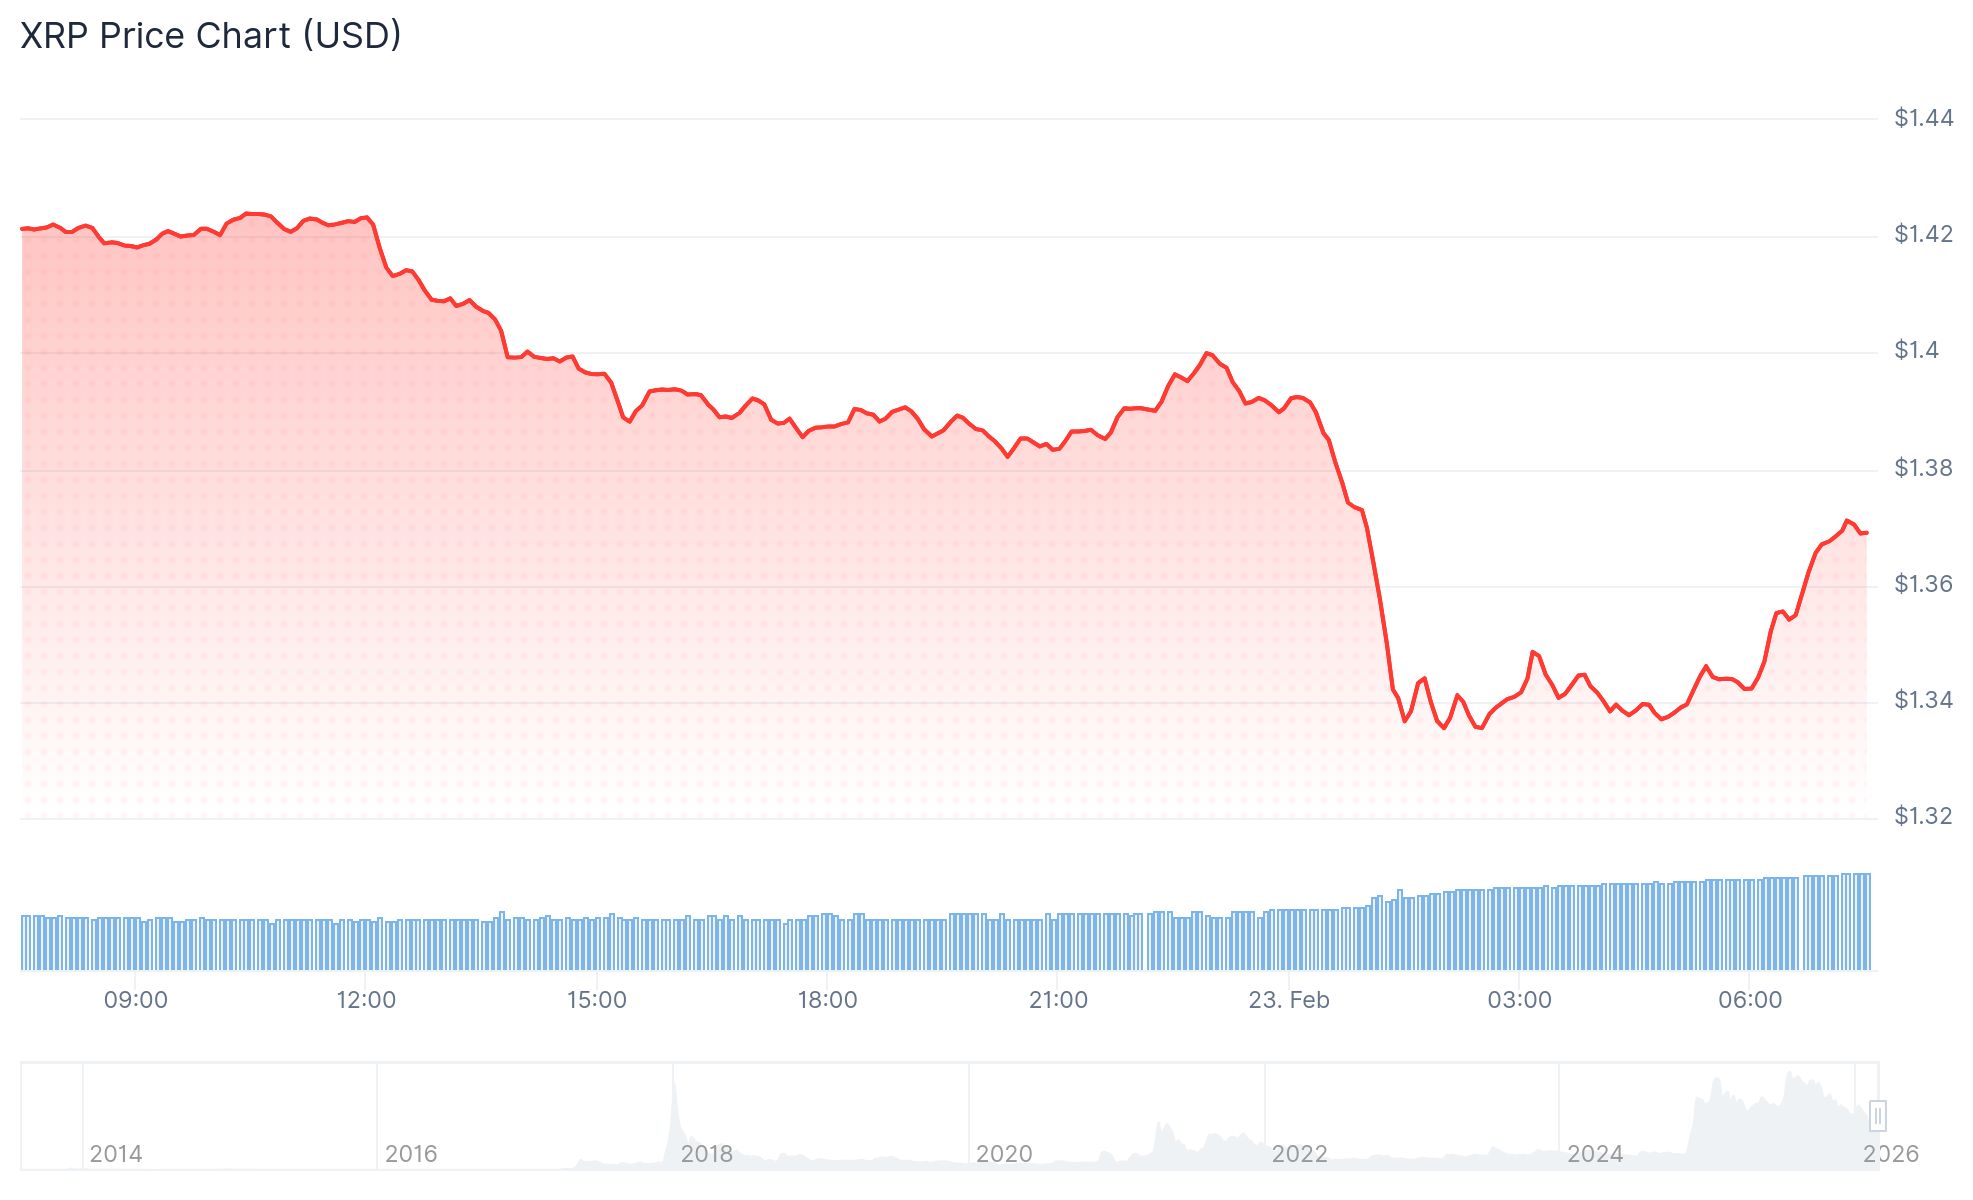
XRP is under pressure. The token was trading at $1.32 at time of writing, down 4.7% in the past 24 hours, as sellers continue to push the price toward a critical support level.
The decline is steep across all timeframes. XRP is down 7% over the past week, 30% over the past month, and nearly 48% over the past year.
From its July 2025 all-time high of $3.65, XRP has now retraced roughly 62%. That mirrors a broader crypto market that has struggled to gain momentum in early 2026.
Despite the price drop, trading activity picked up. Spot volume reached $2.35 billion in 24 hours, a 72% jump from the day before. Futures volume rose 39% to $4.02 billion, while open interest climbed 2.9% to $2.41 billion.
Those numbers suggest traders are actively adding positions as the price tests a key level, not stepping away from it.
On-Chain Realized Losses at 39-Month High
Blockchain analytics firm Santiment reported on February 22 that XRP recorded its largest on-chain realized loss spike since 2022. The previous weekly realized loss peak, around -$1.93 billion, occurred 39 months ago.
📉 BREAKING: XRP has seen its largest on-chain realized loss spike since 2022. When the previous weekly milestone of -1.93B in realized losses occurred 39 months ago, $XRP proceeded to jump +114% over the next 8 months.
💸 Significant realized losses happen when a large number… pic.twitter.com/gPUU8fYfiY
— Santiment (@santimentfeed) February 21, 2026

Realized losses occur when investors sell tokens below what they paid. High spikes like this often appear during panic-driven sell-offs and can signal that weaker holders are exiting the market.
After the 2022 realized loss peak, XRP went on to rally more than 100% over the following months. That does not guarantee a repeat, but the historical parallel is being watched closely.
Price Levels to Watch
XRP is trading below its 100-hourly Simple Moving Average and below the 23.6% Fibonacci retracement of the move from $1.4641 down to $1.3300.
$XRP: Holding the $1.12 low on this Flipped S/R potential would set up the move to our 2nd FIB extension target at $13. Lose support to invalidate this path. pic.twitter.com/39ByRz9mvZ
— 🇬🇧 ChartNerd 📊 (@ChartNerdTA) February 22, 2026
There is a bearish trend line on the hourly chart with resistance at $1.4250. A close above that level would open the path toward $1.45 and then $1.4650.
The RSI has dropped near 30 and is now sitting in the mid-30s, pointing to an oversold condition. No confirmed bullish divergence has formed yet.
The $1.30 level is the line in the sand. Price briefly dipped below it before recovering, showing some buying interest at that zone.
A daily close below $1.30 could push XRP toward $1.20, and then toward the $1.00 psychological level.
The mid-Bollinger Band near $1.42 is the first resistance hurdle. Until XRP reclaims that level, sellers remain in short-term control.


