


TLDR
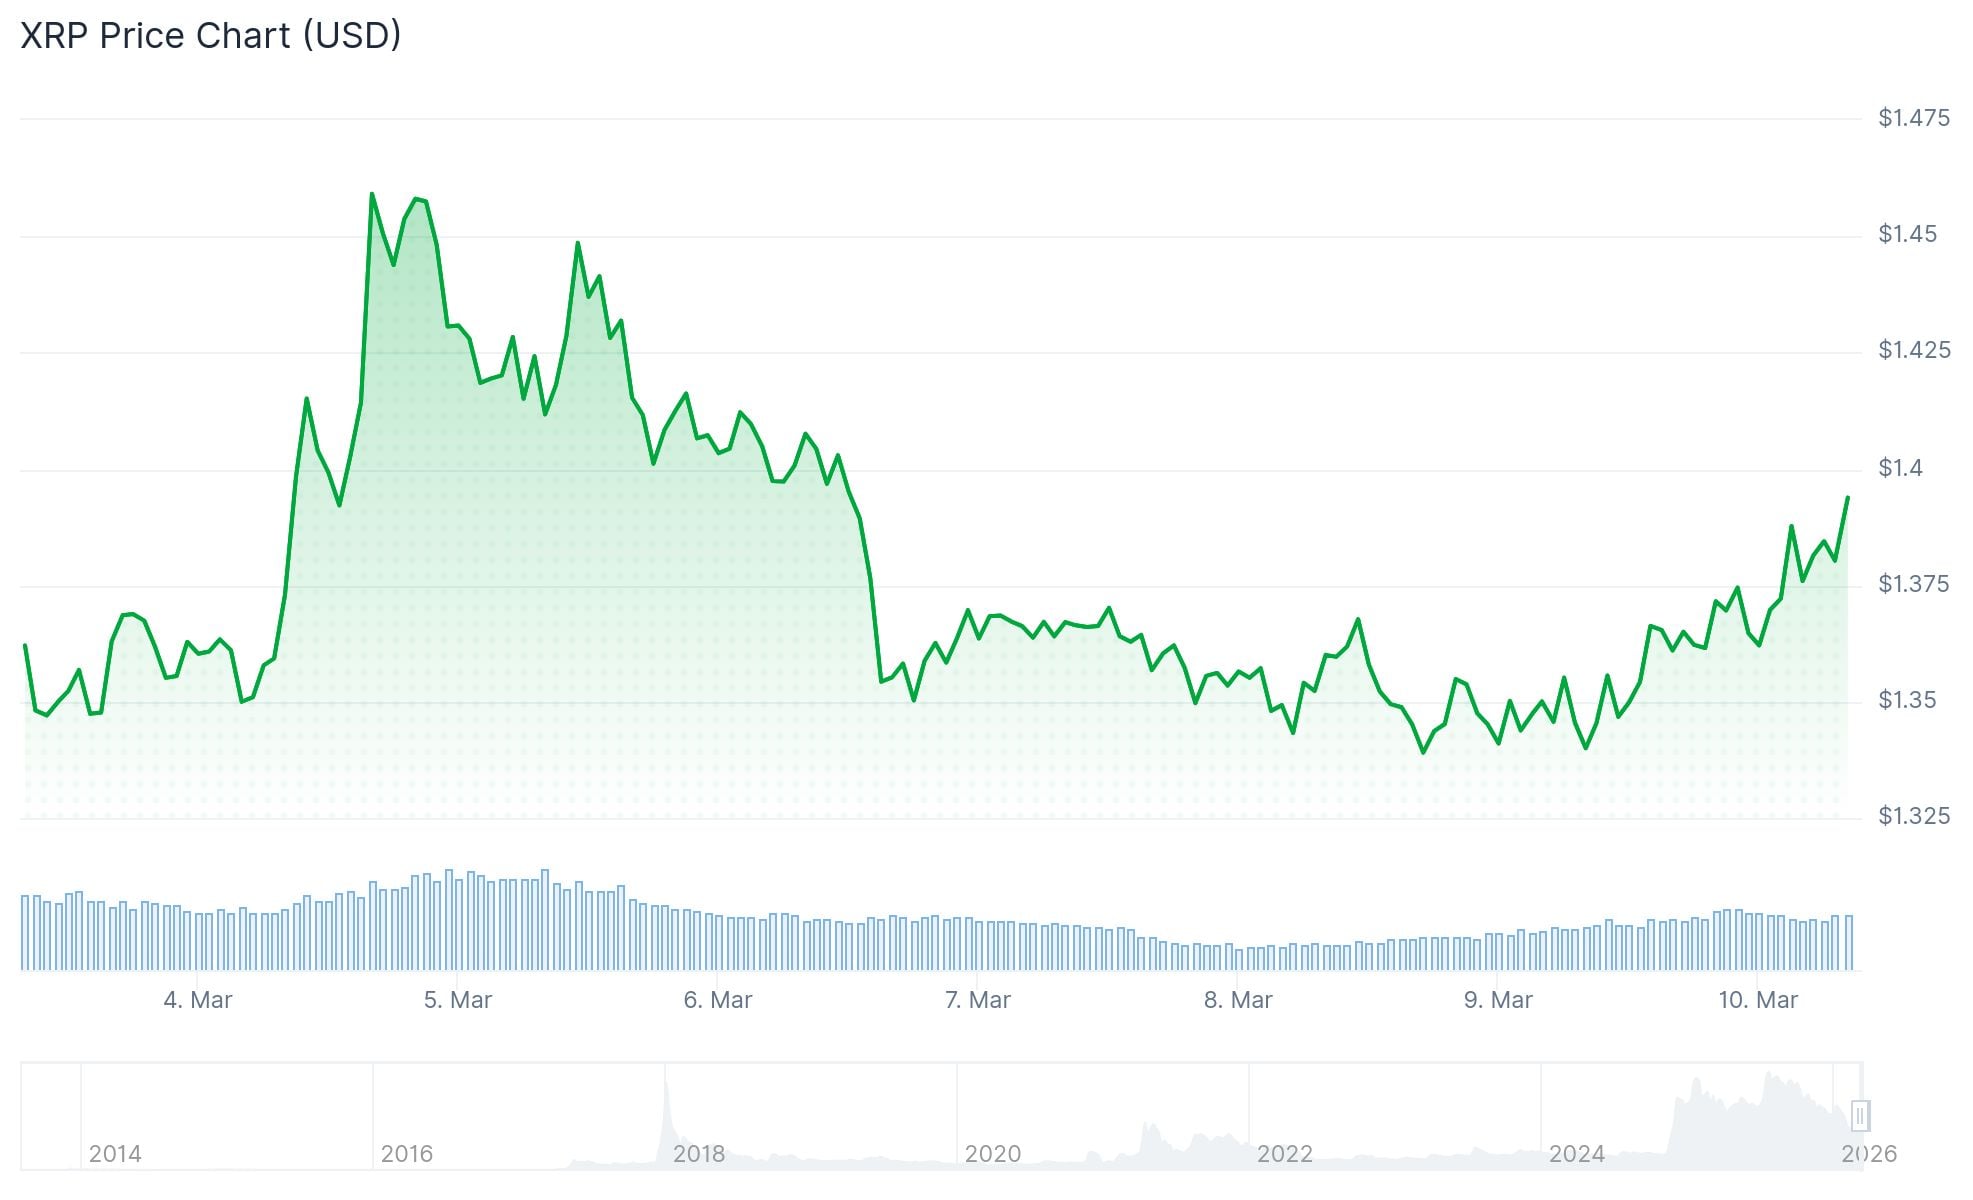
- XRP is trading around $1.36–$1.39, holding above key support at $1.33
- A symmetrical triangle breakout on the daily chart could target $2.06
- XRP investment products saw $30 million in outflows last week
- Stablecoin supply on XRPL rose 2.5% over seven days to $426 million
- Key resistance sits at $1.42, with broader resistance at $1.53 and $1.75–$1.80
XRP is trading near $1.37 on March 10, 2026, recovering from a recent dip to $1.34. The token fell nearly 8% from its weekly high of $1.46 before bouncing back.
The drop came as Bitcoin pulled back on inflation concerns and rising geopolitical tension in the Middle East. XRP rose close to 4% on March 10, touching an intraday high of $1.39 during Asian trading hours.
XRP has been in a corrective phase since hitting a record high of $3.66 in July. The price has been making lower highs and lower lows on the weekly chart, which points to short-term bearish pressure.
Despite that, the size of recent candles has been shrinking. That suggests the price is consolidating rather than collapsing.
Symmetrical Triangle Pattern Takes Shape
On the daily chart, XRP is forming a symmetrical triangle pattern. This is when price moves between two converging trendlines connecting a series of peaks and troughs.
A green candlestick has appeared on the $XRP 3W chart.
This indicates the beginning of a full-scale uptrend. A bullish reversal signal from the sub-indicators will also appear soon.$XRP's real rally is beginning.
The top of this cycle is expected to be $21.5, which is the… pic.twitter.com/NxdlOAhxml
— CW (@CW8900) March 9, 2026
A breakout from the upper side of the triangle would be a bullish signal. Analysts are watching the 23.6% Fibonacci retracement level at $1.42 as the key resistance to clear first.

If XRP breaks above $1.42, the measured target for the triangle pattern sits near $2.06. That would be roughly a 50% move from the current price.
The MACD indicator is pointing upward, and the RSI has formed a bullish divergence with recent price action. Both suggest selling pressure may be easing.
$XRP – After becoming FINANCIALLY FREE buying at 0.28 & massive profits below $3.37🎯
I'll make sure to retire the whole family bloodline using "The REKT" as Exit Liquidity AGAIN during the🚀
Still have massive moonbag for coming📈 taking more profits w/in CALCULATED targets!… pic.twitter.com/VmXZM3YRJS
— JD 🇵🇭 (@jaydee_757) March 9, 2026
Analyst JD noted on March 9 that XRP is tracing a long-term rising trendline going back to early accumulation near sub-$0.01. Each pullback to that trendline has historically attracted buyers.
Resistance in the $3.30–$3.50 range remains the bigger hurdle for any long-term recovery. That zone could be seen as either an ascending triangle ceiling or a rising wedge, depending on interpretation.
Outflows and On-Chain Activity
XRP-tracked investment products saw $30 million in outflows last week, according to CoinShares. Total assets under management stand at around $2.4 billion, with year-to-date inflows still at $123 million.
US spot XRP ETFs recorded $22 million in net outflows over the past two weeks, ending a four-week inflow streak.
Futures Open Interest sits at $2.25 billion, down sharply from its July peak of $10.94 billion.
On the other side, stablecoin supply on the XRP Ledger grew 2.5% over the past seven days to $426 million, according to DeFiLlama. More stablecoins on-chain typically signals growing liquidity and trading activity on the network.
Immediate support is at $1.33. A break below that could open a path to $1.27. On the upside, resistance levels sit at $1.42, $1.53, and $1.75–$1.80.


