


TLDR
- XRP price stays below a descending trendline from $3.20, maintaining a bearish daily structure.
- Weekly chart shows XRP testing a multi-year ascending trendline near the $1.30–$1.40 zone.
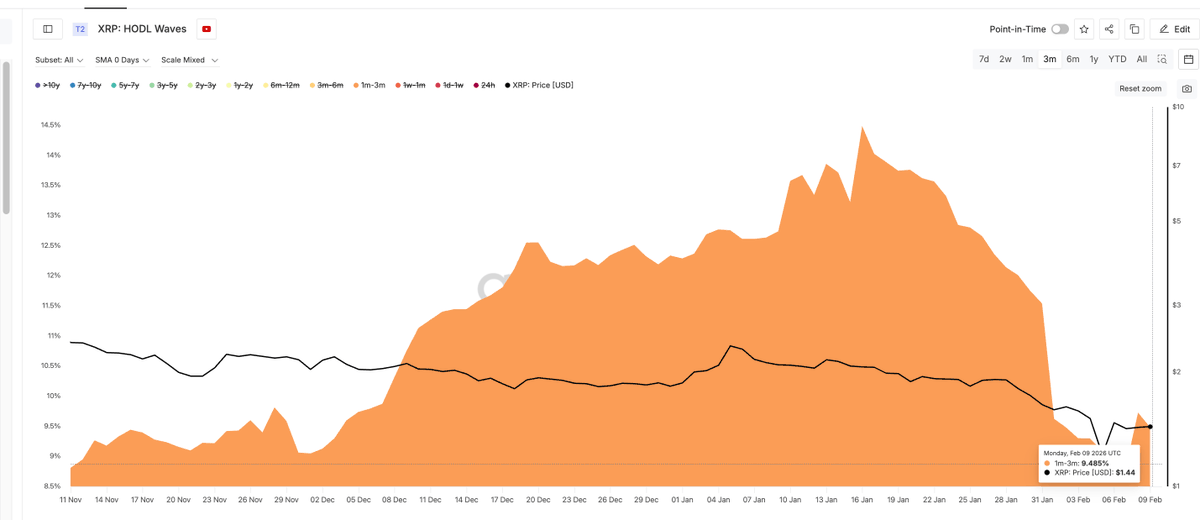
- On-chain data reveals rising long-term holding as price compresses near established support.
- Bulls must reclaim $1.60 and later $2.00 to weaken persistent downside pressure.
Ripple’s XRP price is consolidating near $1.40 after a sharp decline from late-2025 highs above $3.00. Daily and weekly charts show the asset testing critical support between $1.30 and $1.40. At the same time, the $2.00 zone continues to cap recovery attempts. Analysts noted that this compression zone could define the next directional move for XRP price.
XRP Price Remains Below Descending Trendline
According to analyst CRYPTOWZRD, XRP price remains structurally bearish on the daily timeframe. A descending trendline from the $3.10–$3.20 highs continues to suppress rallies. Since that peak, the asset has printed consistent lower highs and lower lows. The broader corrective structure remains intact below $2.00.
Key horizontal levels provide additional context. The $2.70–$2.75 zone flipped from macro support into resistance after the breakdown. Below that, $2.20–$2.30 acted as a pivot before sellers accelerated momentum. More recently, the XRP break beneath $1.60–$1.55 triggered a flush toward $1.30.
XRP Daily Technical Outlook:$XRP closed indecisively. We’ll have to wait for a more mature chart. Moving above the $1.5300 resistance will offer a long. Below $1.3820 is the main support. We now need to wait for the market to get the next trade opportunity 🤔 pic.twitter.com/XKPYVCCoaH
— CRYPTOWZRD (@cryptoWZRD_) February 11, 2026
A long downside wick near $1.30 indicates reactive demand. However, consolidation between $1.30 and $1.50 remains fragile. Bulls must reclaim at least $1.60 on a daily close to ease pressure. Until a higher high forms, the daily bias favors cautious positioning.
XRP Price Tests Support Near $1.40
Meanwhile, analyst Steph highlighted a long-term ascending trendline on the weekly chart. This structure connects cycle lows dating back to 2017, when price traded below $0.01. It also captured the 2024 retest near $0.40–$0.50. XRP price is now revisiting this macro support around $1.40.
Historically, reactions from this rising trendline preceded major expansions. The 2017 touch led to a rally beyond $3.00. Similarly, the 2024 bounce fueled a move above $3.00 before distribution resumed. Holding above $1.30–$1.40 would preserve higher lows on the multi-year chart.

🚨 $XRP LEGENDARY SUPPORT!! pic.twitter.com/HbjD1nNDcV
— STEPH IS CRYPTO (@Steph_iscrypto) February 11, 2026
However, a decisive weekly close below this support would shift the broader structure. Such a breakdown could expose $0.80–$1.00 as the next macro target. As long as XRP price respects the ascending trendline, the higher timeframe thesis remains constructive. Resistance between $2.50 and $3.00 stands as the next macro barrier.
On-chain Data Supports $1.30 base
In addition, on-chain HODL Waves data provides further context. The orange band expansion shows increasing mid-to-long-term coin holding durations. This trend intensified as XRP price retraced from above $3.00 toward $1.40. It suggests that longer-term participants are absorbing supply.
At the same time, shorter-duration bands have thinned. This indicates speculative supply declined following the recent sell-off. Historically, similar dormancy expansions have appeared near corrective bottoms. The $1.30–$1.40 zone now aligns with growing long-term holding metrics.
From a structural perspective, continued compression near $1.40 could signal accumulation. However, a break below $1.30 would weaken that interpretation. Reclaiming $1.60 and eventually $2.00 remains essential for bullish confirmation. Until then, XRP price trades between firm support and overhead resistance.


