


TLDR
- XRP holds $1.85–$1.90 support, signaling reduced downside pressure.
- Inverse head-and-shoulders forms with $2.25–$2.30 as key breakout resistance.
- RSI compression suggests momentum is building but still unconfirmed.
- Liquidity clusters between $1.80–$2.20 likely dictate the next directional move.
XRP price is trading within a tightening technical range as structure, momentum, and liquidity signals converge. Multiple analysts highlight key inflection levels near $1.80 support and $2.30 resistance. While no confirmed breakout has occurred, chart structures suggest XRP price is approaching a decisive phase.
XRP Price Holds Key Support as Structure Forms
According to analyst CRYPTOWZRD’s daily technical outlook, XRP price is transitioning from extended corrective pressure into a potential basing phase. Price action remains compressed beneath a descending trendline while consistently holding above the $1.85–$1.90 support zone. This zone has absorbed repeated sell attempts, signaling reduced downside momentum.
Structurally, the chart shows a developing inverse head-and-shoulders formation. The left and right shoulders are well-defined, while the head marks the deepest corrective low. This setup suggests sellers are losing control as buyers continue defending demand levels with consistency.
XRP Daily Technical Outlook:$XRP closed indecisively. A move above $2.0000 would support further upside. My focus will be on the lower time frame. Holding above the $1.9750 resistance is bullish. A rejection there would offer short opportunities 😈 pic.twitter.com/ukcmeU4HFi
— CRYPTOWZRD (@cryptoWZRD_) January 28, 2026
The neckline resistance aligns with the $2.25–$2.30 zone, reinforcing its technical significance. A confirmed daily close above this level would indicate a structural trend shift. Until that occurs, XRP price remains in a transitional phase rather than a confirmed bullish trend.
XRP Price Momentum Compresses as RSI Signals Build
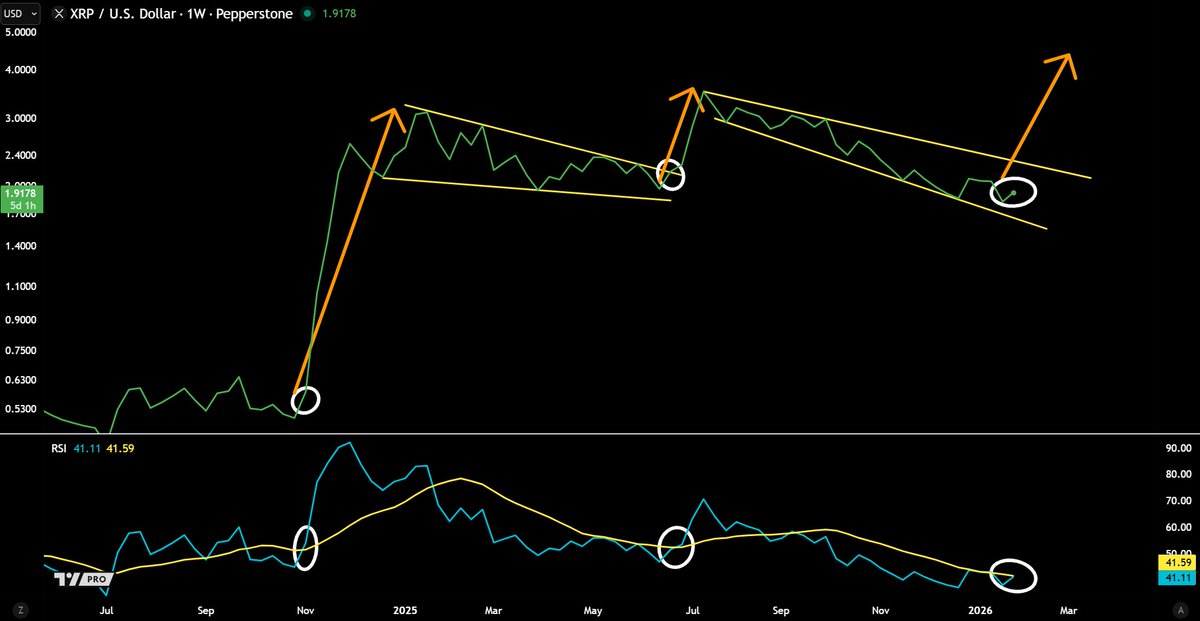
Meanwhile, JD’s weekly analysis focuses on momentum rather than price structure alone. XRP price is shown trading within a recurring consolidation pattern that has historically preceded directional expansion. Similar structures earlier in the cycle resolved with sharp upside moves.
The RSI indicator remains compressed near its mid-range, reflecting equilibrium between buyers and sellers. Historically, such compression has preceded strong moves once RSI breaks above its descending resistance line. JD suggested that a confirmed RSI crossover would signal a momentum inflection.

However, downside risk persists if RSI fails to sustain an upward break. A rejection could push XRP price back toward the highlighted demand zone. Until momentum confirms, the broader structure remains technically neutral rather than directional.
XRP Price Trapped as Liquidity Dominates Direction
Additionally, analyst Steph Is Crypto’s liquidity-based analysis explains XRP’s persistent range-bound behavior. Binance liquidation heatmap data reveals dense liquidity clustered between $1.80 and $2.20. This concentration continues to attract price, limiting sustained directional movement.
Price tends to gravitate toward zones with heavy leveraged positioning. Market participants exploit these areas as liquidation targets. The heatmap shows stacked liquidity both above and below current levels, reinforcing the idea that XRP price remains structurally trapped.

A liquidity sweep above $2.30 could trigger short liquidations and unlock upside continuation. Conversely, a drop below $1.80 may force long liquidations. According to the data, XRP price direction will likely be driven by liquidity resolution rather than sentiment.


