


TLDR
- XRP’s TD Sequential indicator has flipped to “buy” at $2.86, suggesting selling pressure may be ending
- The token is currently trading at $2.88, testing critical support near the .618 Fibonacci retracement level
- Technical analysis shows bearish momentum with RSI at 42 and price below the 9-day DEMA
- Elliott Wave analysis points to potential bullish reversal if current support holds
- Key resistance levels identified at $2.93, $3.08, and $3.41 for any upward movement
XRP is trading at $2.88 after finding support near the $2.86 level where a key technical indicator has shifted. The TD Sequential indicator, which previously called XRP’s recent peak, has now generated a buy signal.
$XRP looks ready to rebound as the TD Sequential prints a buy on the hourly chart! pic.twitter.com/jTNQZzU8EX
— Ali (@ali_charts) August 21, 2025
This development comes as XRP tests important technical levels. The token has been bouncing between $2.82 and $2.88 throughout recent trading sessions.
The current price action shows XRP pressing against the lower Bollinger Band around $2.78. This area has provided support during the recent decline.
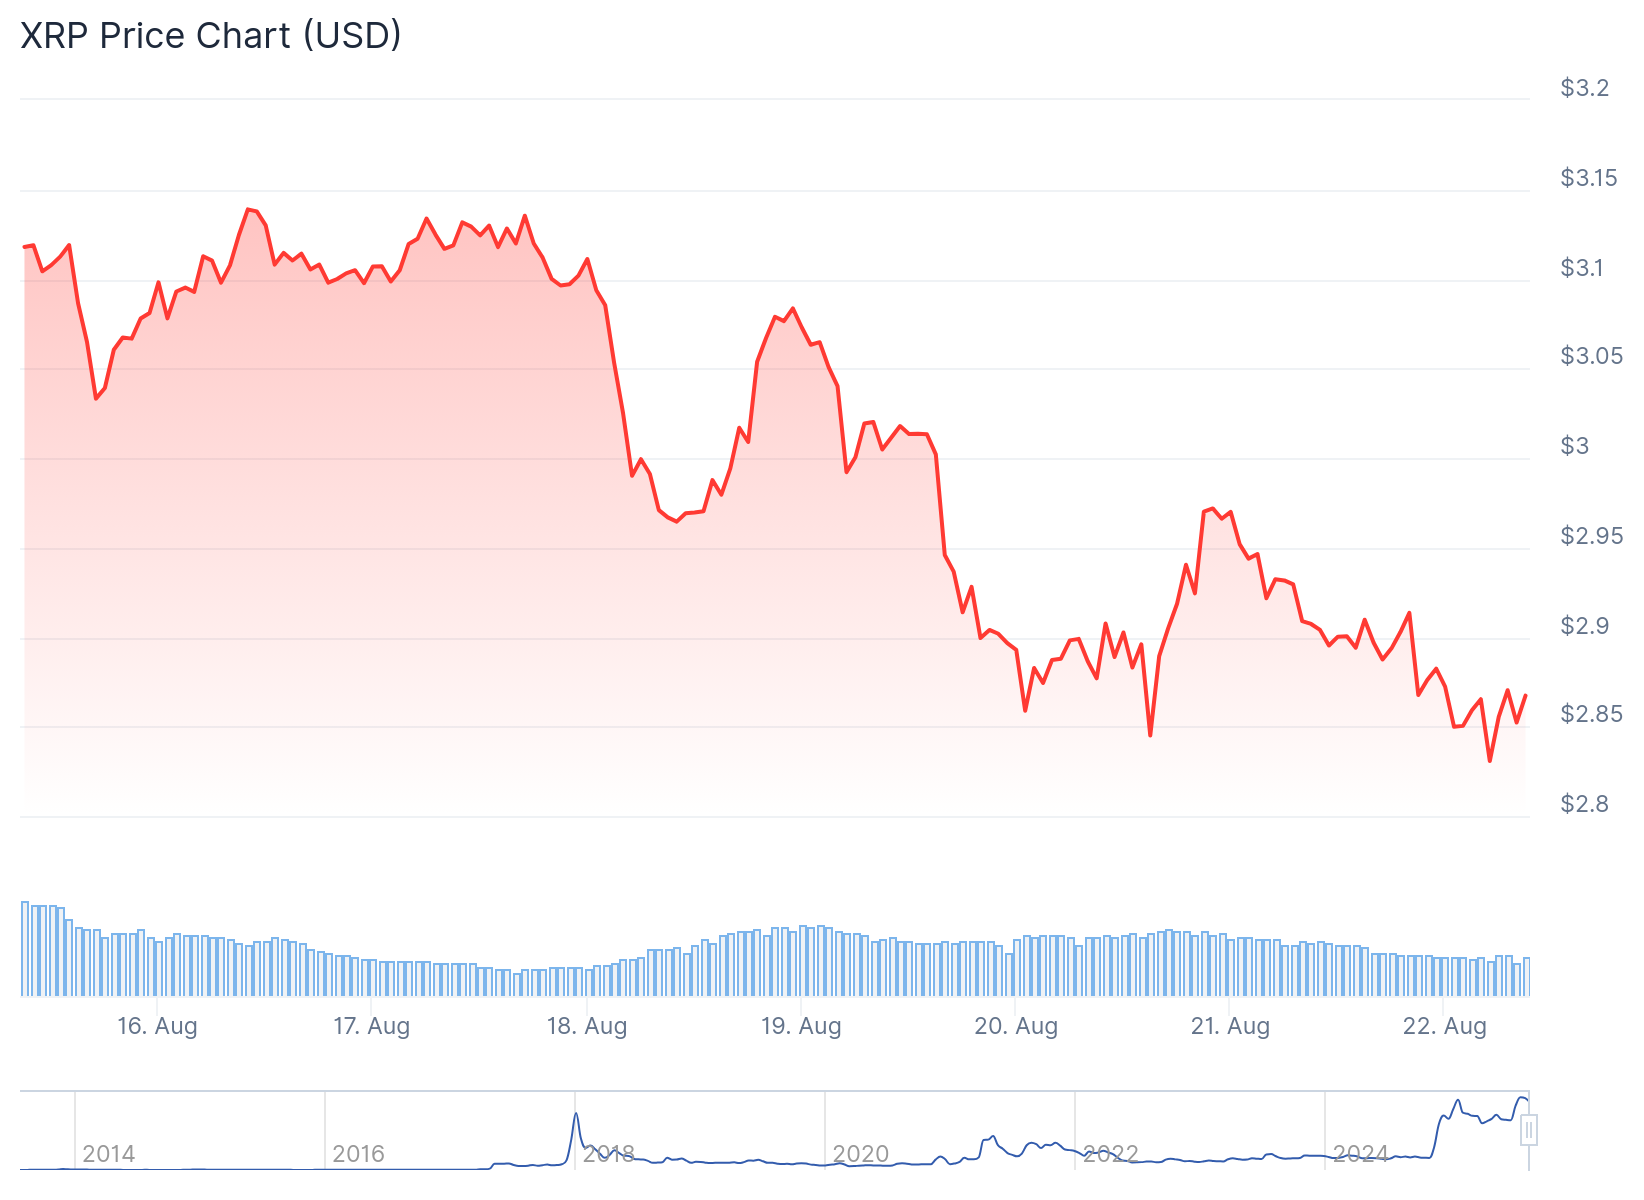
Technical indicators present a mixed picture for XRP. The RSI sits at 42, indicating bearish sentiment. The MACD histogram shows deeper negative readings.
XRP is trading below its 9-day DEMA, which has shifted to act as resistance. The 20-day SMA at $3.08 represents the mean-reversion target if buyers return.
Support and Resistance Levels
The $2.88 level aligns with a .618 Fibonacci retracement according to Elliott Wave analysis. This technical confluence makes the area particularly important for determining XRP’s next direction.

If the current support fails, the next areas to watch are between $2.72 and $2.70. A deeper correction could extend to $2.62.
On the upside, XRP faces immediate resistance at $2.93. This level previously served as support but has now flipped to resistance.
The $3.08 level represents the next major hurdle. This coincides with the 20-day moving average where supply is expected.
Beyond that, resistance appears at $3.20-$3.22. The upper Bollinger Band at $3.38 serves as a longer-term target.
XRP Price Prediction
Market analyst CasiTrades has identified the current support area as a textbook subwave 2 target in an Elliott Wave pattern. This analysis suggests XRP could be setting up for subwave 3, typically the strongest part of an impulse move.
🚀XRP Golden Retracement Is Holding. Targeting $3.41 Resistance! 🚀
I’m leaning bullish here. The structure is starting to look really interesting… $XRP reaching its .618 retracement ($2.88), which lines up as the textbook subwave 2 target in Elliott Wave Theory. This is the… pic.twitter.com/kWV72IhE40
— CasiTrades 🔥 (@CasiTrades) August 21, 2025
The Elliott Wave view projects resistance at $3.41 as the next target. The analysis also highlights $3.21 as a critical marker for momentum continuation.
A break above $3.21 could lead to a backtest before resumption of the upward move. This scenario would favor a rally beyond the current trading range.
The pattern suggests potential for new highs if the current support structure holds. However, this depends on XRP maintaining its position above the $2.88 support zone.
Current price action shows XRP “walking the band” along the lower Bollinger Band. This type of movement typically indicates trend continuation rather than sharp reversals.
For bulls to take control, XRP needs a daily close above $2.93. This would reduce bearish pressure and shift sentiment toward neutral or bullish territory.
The token’s ability to hold above $2.88 will determine whether the TD Sequential buy signal proves accurate. A break below this level would invalidate the bullish technical setup.
XRP continues to test the $2.88 support level as traders watch for confirmation of the potential reversal signal.


