


 Price Prediction: Massive $2.4 Billion Leverage Flush Sets Stage for Potential Rally")


TLDR
- XRP saw its largest leverage flush since May with $2.46 billion in Open Interest wiped out in under a week
- Price dropped 13% from $3.60 high but is holding key support between $3.10-$3.20
- Whales accumulated 60 million XRP tokens during the recent dip showing institutional confidence
- XRP/ETH pair hit same support zone that previously triggered 25% bounce and 80% rally
- Analyst warns of potential crash to $0.80-$1.30 in next bear market based on historical patterns
XRP price experienced its most severe leverage flush since May as Open Interest plummeted $2.46 billion in less than a week. The cryptocurrency fell 13% from its local high of $3.60 as traders unwound positions.
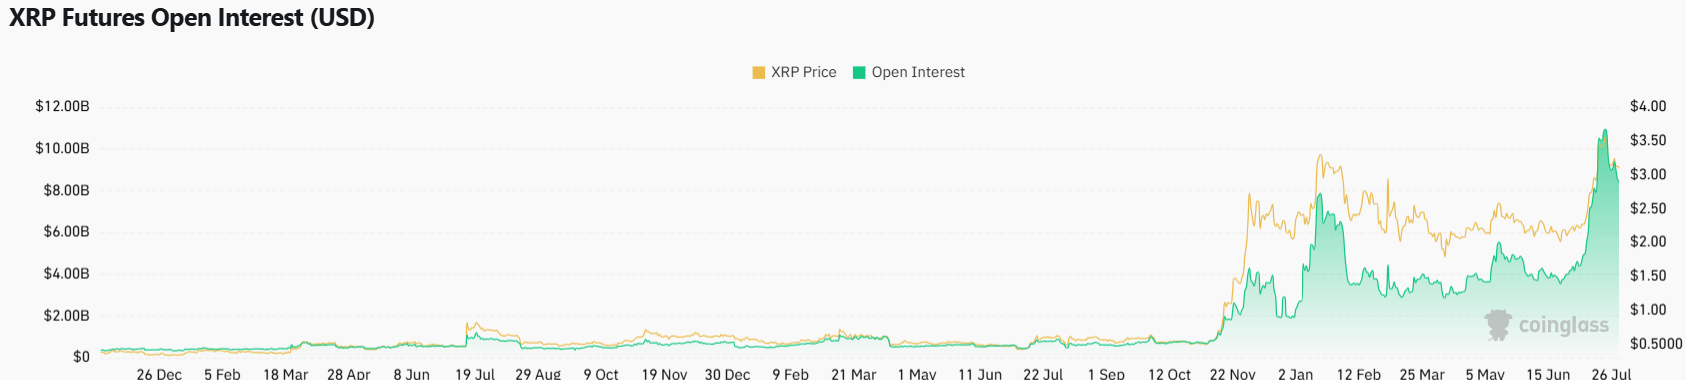
The selloff began after XRP’s Open Interest reached a record $10.94 billion on July 22. Within days, that figure dropped to $8.48 billion as leveraged positions were liquidated across the market.
Capital rotation played a key role in XRP’s decline. The XRP/ETH trading pair fell 7.54% as Ethereum bounced 11% from its $3,530 support level. Traders moved funds from XRP back into Ethereum during this period.
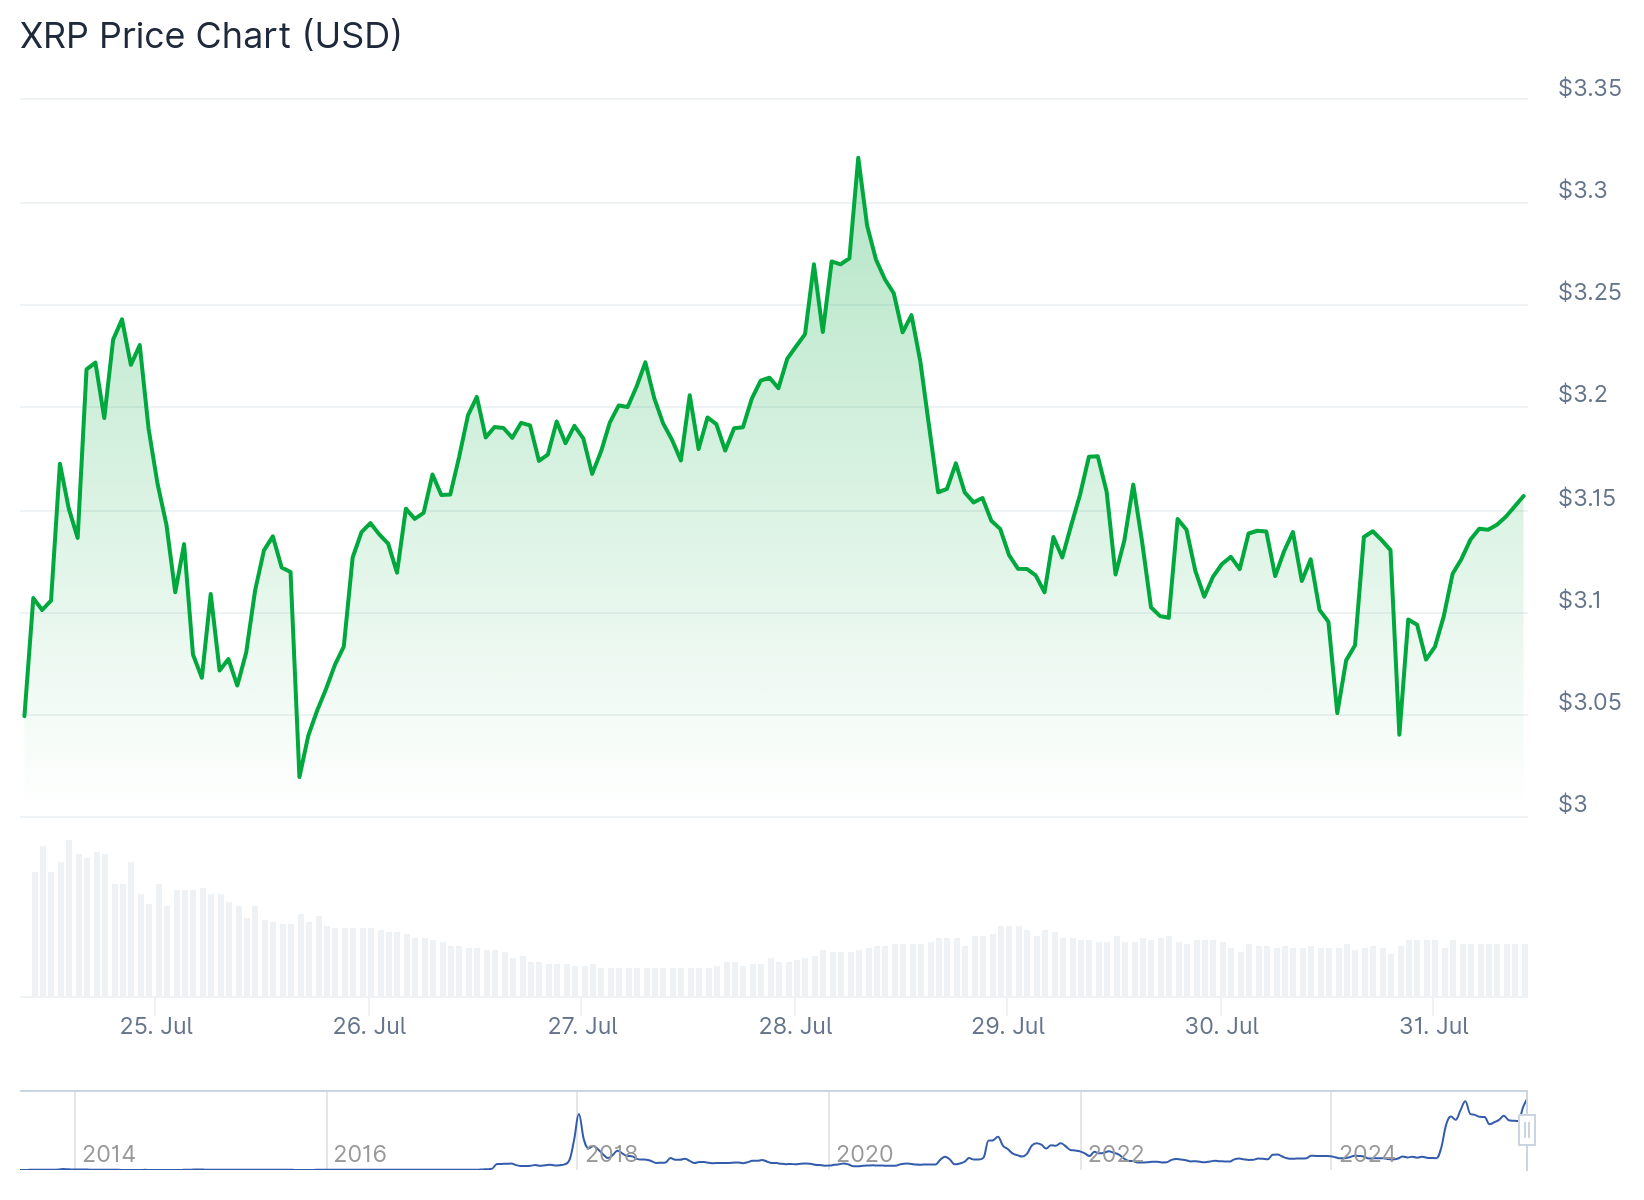
Despite the sharp Open Interest decline, XRP’s price action shows resilience. The token is holding steady between $3.10 and $3.20, which represents a key demand zone on technical charts.
This price stability during heavy leverage unwinding suggests strong spot buying interest. Previous similar flushes resulted in smaller price drops relative to the Open Interest decline.
Whale Activity Shows Confidence
Large investors continue accumulating XRP during the recent weakness. Whales purchased 60 million XRP tokens in a single day according to blockchain data.

This accumulation pattern contrasts with the bearish derivatives data. Futures Open Interest dropped 6% to $8.38 billion as retail sentiment turned negative.

The whale buying activity indicates institutional investors view current prices as attractive entry points. Their continued accumulation suggests confidence in XRP’s longer-term prospects.
Historical data supports the potential for a rebound from current levels. The XRP/ETH pair recently touched the same support zone that triggered a 25% bounce between mid-June and mid-July.
That previous bounce kicked off an 80% rally in XRP from its $2 base. The pattern coincided with Open Interest spiking from $4 billion to $10 billion as new leveraged positions entered the market.
Technical Levels Point to Potential Breakout
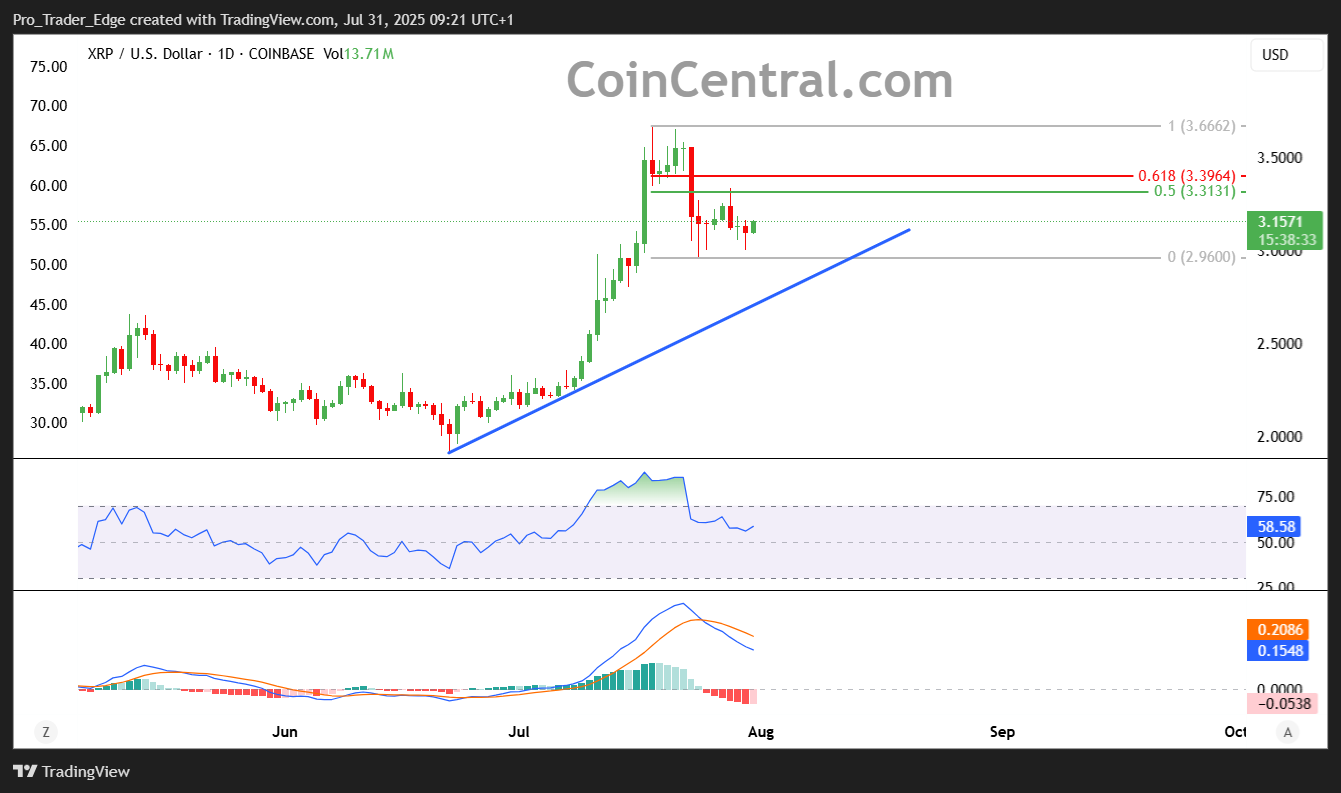
The daily chart shows XRP price forming a compression pattern between $3.10 and $3.20. These tight trading ranges often precede larger directional moves in bull markets.
Several technical indicators aligned with the recent Open Interest flush. Funding rates became overheated, RSI readings stretched to extreme levels, and Realized Profits spiked above $1 billion.
The $1 billion Realized Profits figure marked the largest spike since the post-election period. This suggests many holders took profits during XRP’s recent rally to $3.60.
One analyst predicts XRP could crash to $0.80-$1.30 in the next bear market cycle. The forecast uses historical patterns and symmetrical triangle measurements from the 2017 bear market.
The same analysis suggests XRP could reach $9 or $27 in the current bull cycle before any major correction occurs. These projections assume the market follows previous cyclical patterns.
Current technical analysis shows $3.07 as critical support for XRP’s price. A break below this level could invalidate near-term bullish targets of $3.61 and $5.85.
XRP traded at $3.07 during the recent session, down 2.9% for the day and extending weekly losses to 8.35% while maintaining monthly gains above 40%.


