


 Price: Support Holds But Can Bulls Break Through $2.20 Wall?")


TLDR
- XRP price declined to $2.085 support level but is now attempting to recover above $2.150
- A bearish head-and-shoulders pattern suggests further declines toward $2.00 target
- Key resistance sits at $2.20 level with support at $2.140 trend line
- Technical indicators show mixed signals with RSI above 50 but MACD showing bearish crossover
- Standard Chartered projects XRP could reach $5.50 by end of 2025 due to potential ETF approvals
XRP price has started a recovery attempt after testing critical support levels near $2.080. The cryptocurrency declined below $2.250 and $2.20 levels before finding a floor at $2.085.
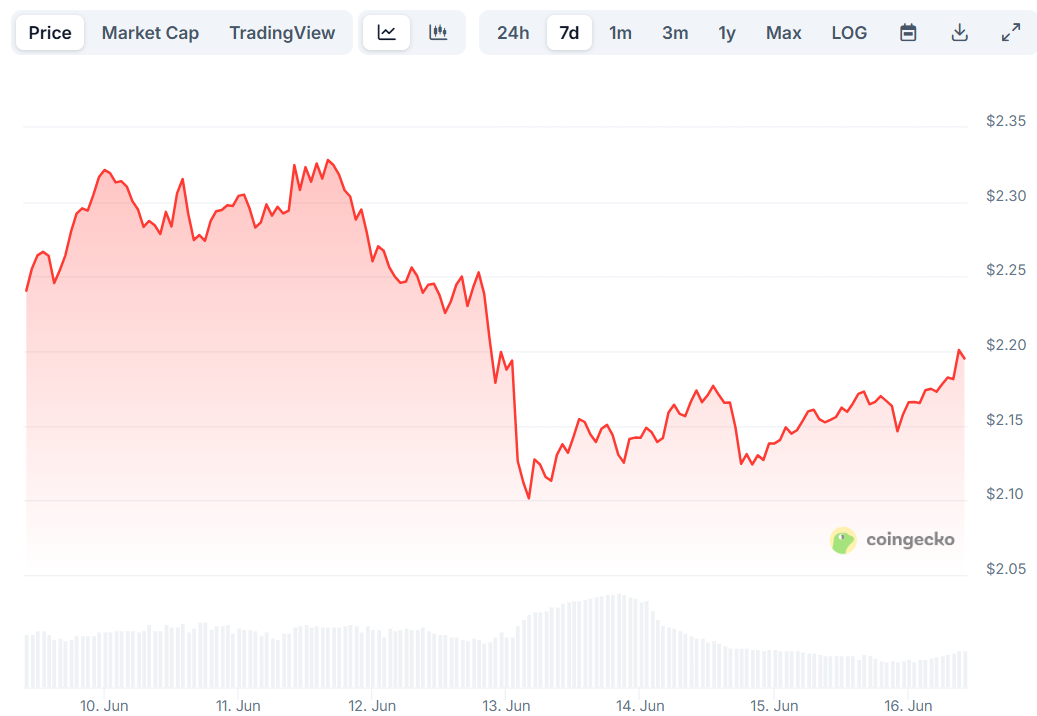
The price has since moved above $2.10 and $2.120 levels. XRP climbed above the 23.6% Fibonacci retracement level of the downward move from the $2.338 swing high to the $2.085 low.
A short-term rising channel is forming with support at $2.140 on the hourly chart. The price is now trading above $2.150 and the 100-hourly Simple Moving Average.
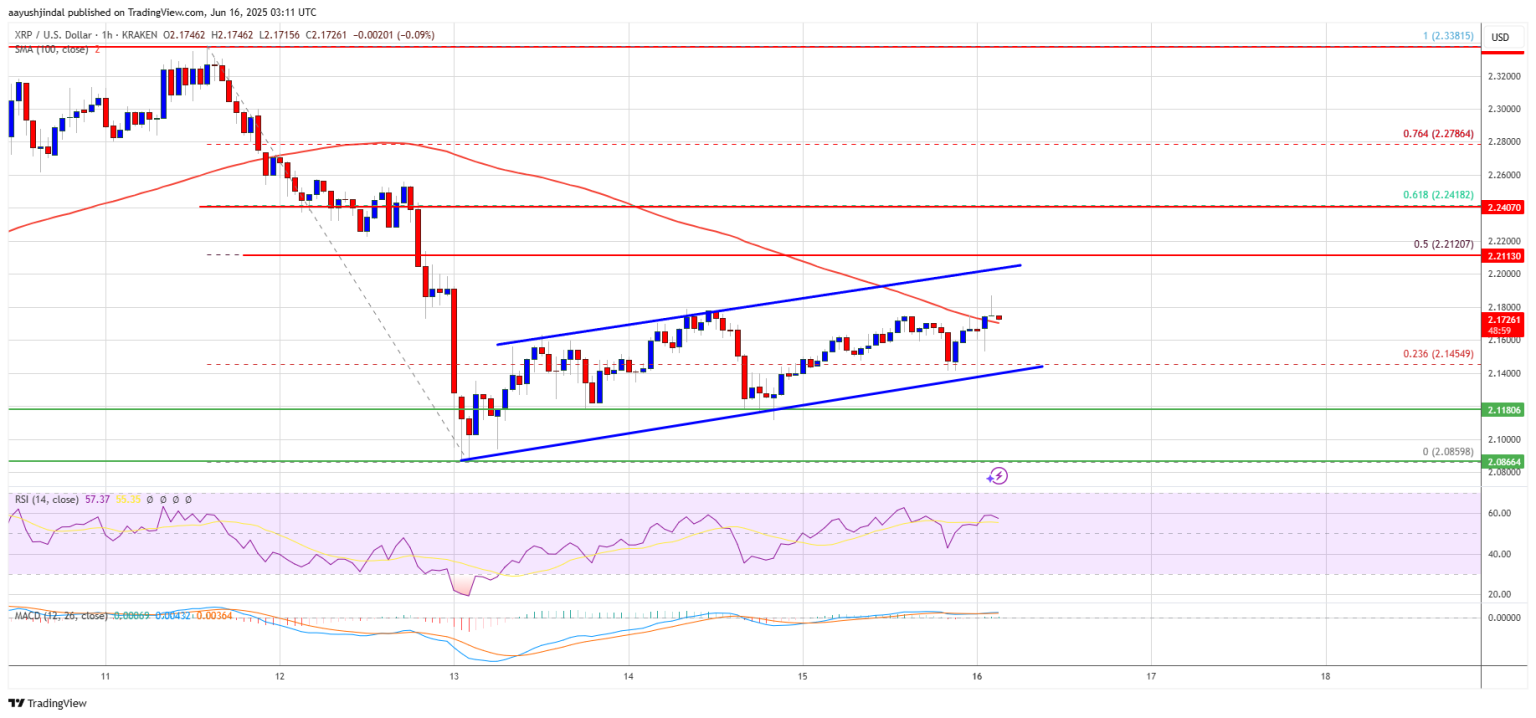
The recovery faces immediate resistance near the $2.20 level. The first major resistance sits at $2.2120, close to the 50% Fibonacci retracement level.
If XRP clears the $2.20 resistance zone, the next target would be $2.250. A break above this level could send the price toward $2.320 resistance.
Technical Pattern Shows Bearish Outlook
XRP has confirmed a bearish head-and-shoulders pattern that suggests further declines toward $2.00. The token has struggled to maintain momentum above the crucial $2.2 support level.
Multiple rejections at this level have led to declining buyer confidence. The 50-day EMA presents another potential rejection point for the cryptocurrency.

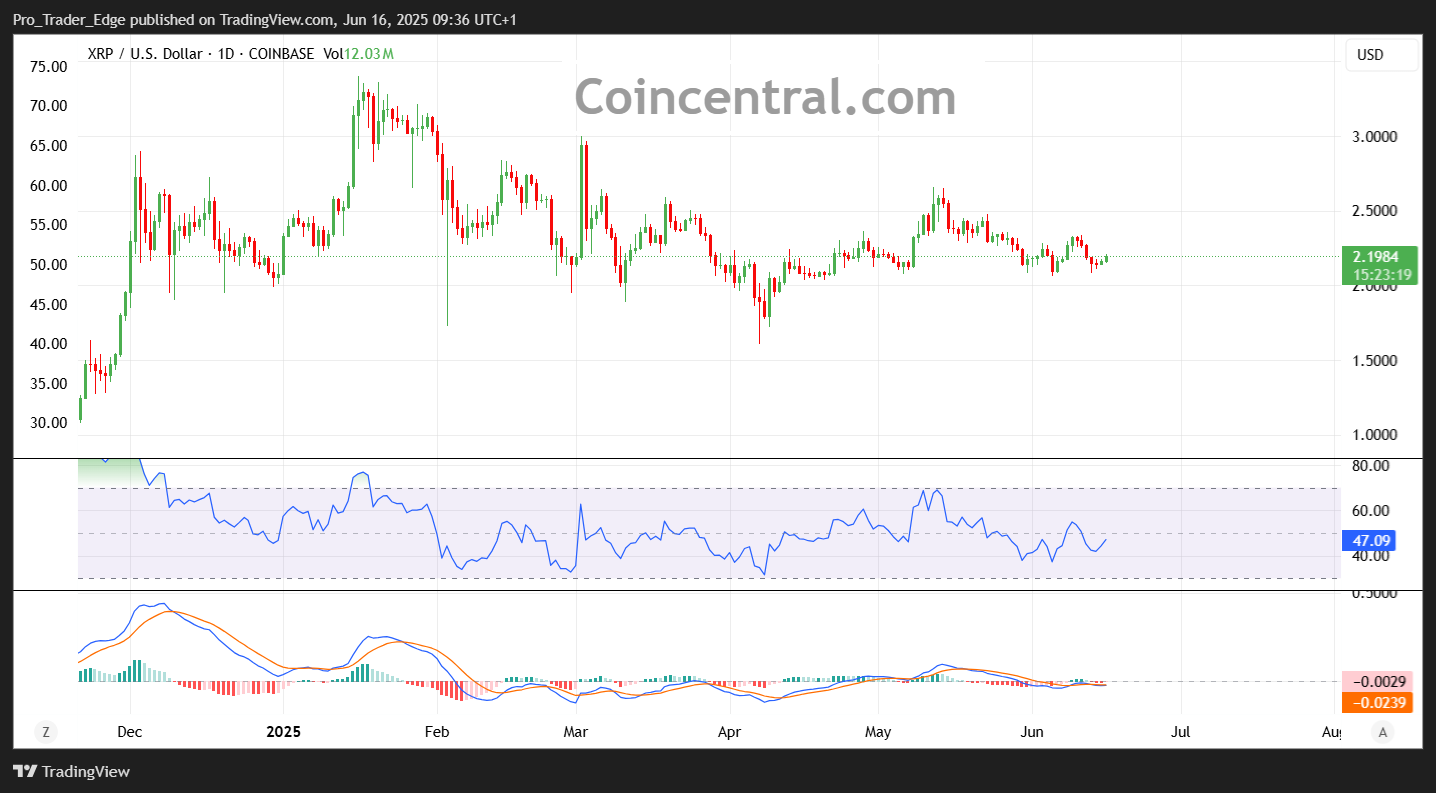
The daily chart shows strong bearish momentum with the RSI at 45, below its neutral level and trending downward. The MACD indicator has displayed a bearish crossover, signaling a sell-off and downward trend.
If XRP fails to hold above $2.120, the price might continue declining toward the $2.080 support. The next major support sits near the $2.020 zone.
A break below current support levels could lead to a retest of the $1.96 daily support level. The 200-day EMA decline could push bears to target sub-$2 levels.
Key Levels and Future Outlook
On the upside, hourly technical indicators show some positive signs. The MACD for XRP/USD is gaining pace in the bullish zone.
The hourly RSI is now above the 50 level, suggesting short-term buying interest. Major support levels remain at $2.150 and $2.120.
Major resistance levels sit at $2.20 and $2.2120. A sustained move through the 50-day EMA could lead to $2.5 and the May 12 high of $2.68.
Factors such as regulatory decisions and ETF approvals will influence XRP’s short-term prospects. Judge Torres’ decision and SEC appeal strategies remain key catalysts.
Standard Chartered projects XRP might reach $5.50 by the end of 2025, mainly due to expected ETF approvals and increased institutional interest. XRP trades at $2.196 with minimal daily change.


