


TLDR
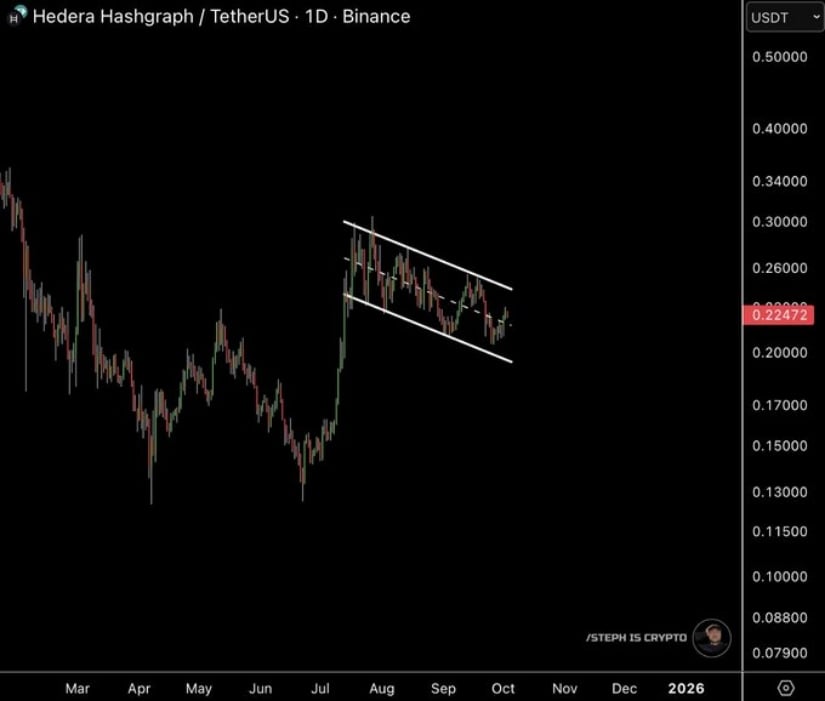
- HBAR is trading at $0.22, showing price compression in a descending channel.
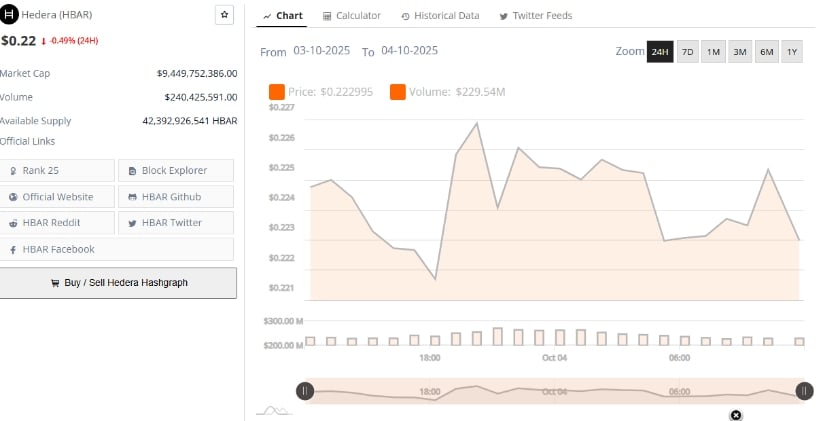
- Hedera maintains a $9.44 billion market cap despite recent price stagnation.
- The Chaikin Money Flow for HBAR is positive at 0.04, signaling quiet accumulation.
- HBAR’s MACD hints at potential bullish momentum as the token nears a breakout.
Hedera (HBAR) is currently experiencing tight price compression within a descending channel, with its value hovering around $0.22. After a recent rally, the asset has encountered resistance, leading to lower highs and a range-bound trading structure. As a result, traders are closely monitoring for any breakout that could trigger a move in either direction. The market’s cautious sentiment suggests that a decisive shift may be on the horizon.
Price Action Within a Descending Channel
Hedera’s recent price action has been marked by compression, as the asset trades within a defined descending channel. This pattern has been in place since the token rallied in early August. During this period, HBAR has struggled to break past the upper boundary of the channel, with each attempt met by renewed selling pressure. Conversely, the lower boundary has seen increasing accumulation as bulls defend support levels around $0.20.
Such price compression often signals a coiling market, where volatility is compressed, setting the stage for a potential breakout. The price action indicates a tug-of-war between the bulls defending key support levels and bears pressing resistance.
Traders are now focused on the possibility of a breakout either above the channel’s upper resistance or a potential breakdown below the $0.20 support zone. The next significant move will depend largely on market volume and the broader market sentiment.
Market Sentiment Remains Cautiously Neutral
Despite recent price declines, the overall market sentiment surrounding Hedera remains cautiously neutral. At the time of writing, HBAR is trading at approximately $0.22, showing a slight decline of about 0.49% over the past 24 hours.
With a market capitalization of $9.44 billion, the project remains within the top 25 cryptocurrencies globally. Additionally, HBAR continues to show healthy liquidity, indicating that investor interest in the token has not waned despite recent sideways action.

The market’s hesitation appears more tied to the technical compression within the price action rather than a shift in the project’s fundamentals. Hedera’s network continues to build traction, particularly in the enterprise and Web3 sectors. Even as short-term traders focus on immediate price movements, long-term investors are likely still maintaining interest, given the network’s ongoing growth.
Momentum Indicators Reflect Gradual Strength
While price action remains range-bound, momentum indicators are showing early signs of potential strength for HBAR. The Chaikin Money Flow (CMF), which tracks capital inflows and outflows, is currently positive at 0.04.
Although modest, this indicates a quiet accumulation phase, suggesting that buyers are still active beneath the surface. A sustained CMF above 0.05 could further support a bullish outlook, while a dip back into negative territory could signal a shift in sentiment.
Additionally, the Moving Average Convergence Divergence (MACD) is showing early signs of a potential recovery. The MACD line is approaching a bullish crossover with the signal line, indicating that upward momentum could be building. While this is not yet a definitive signal, it provides some indication that HBAR may be gearing up for a stronger move in the coming days or weeks.
Key Levels to Watch
For traders, the key levels to monitor are $0.20 on the downside and $0.24 on the upside. A firm defense of the $0.20 support zone by bulls would suggest a higher likelihood of a breakout to the upside, while a failure to hold this level could expose HBAR to further downside risk. Similarly, a decisive move above the $0.24 resistance could confirm a bullish reversal and trigger further buying activity.
In summary, Hedera is in a consolidation phase, with the price action constrained within a descending channel. The technical indicators suggest a neutral-to-bullish outlook, but the breakout from this pattern will likely dictate the next significant price move. Traders will continue to watch for increased volume and price action beyond the established range for further direction.


