


 Price: Falls Below $65,000 as Whale Selling and Tariff Fears Weigh on Market")


TLDR
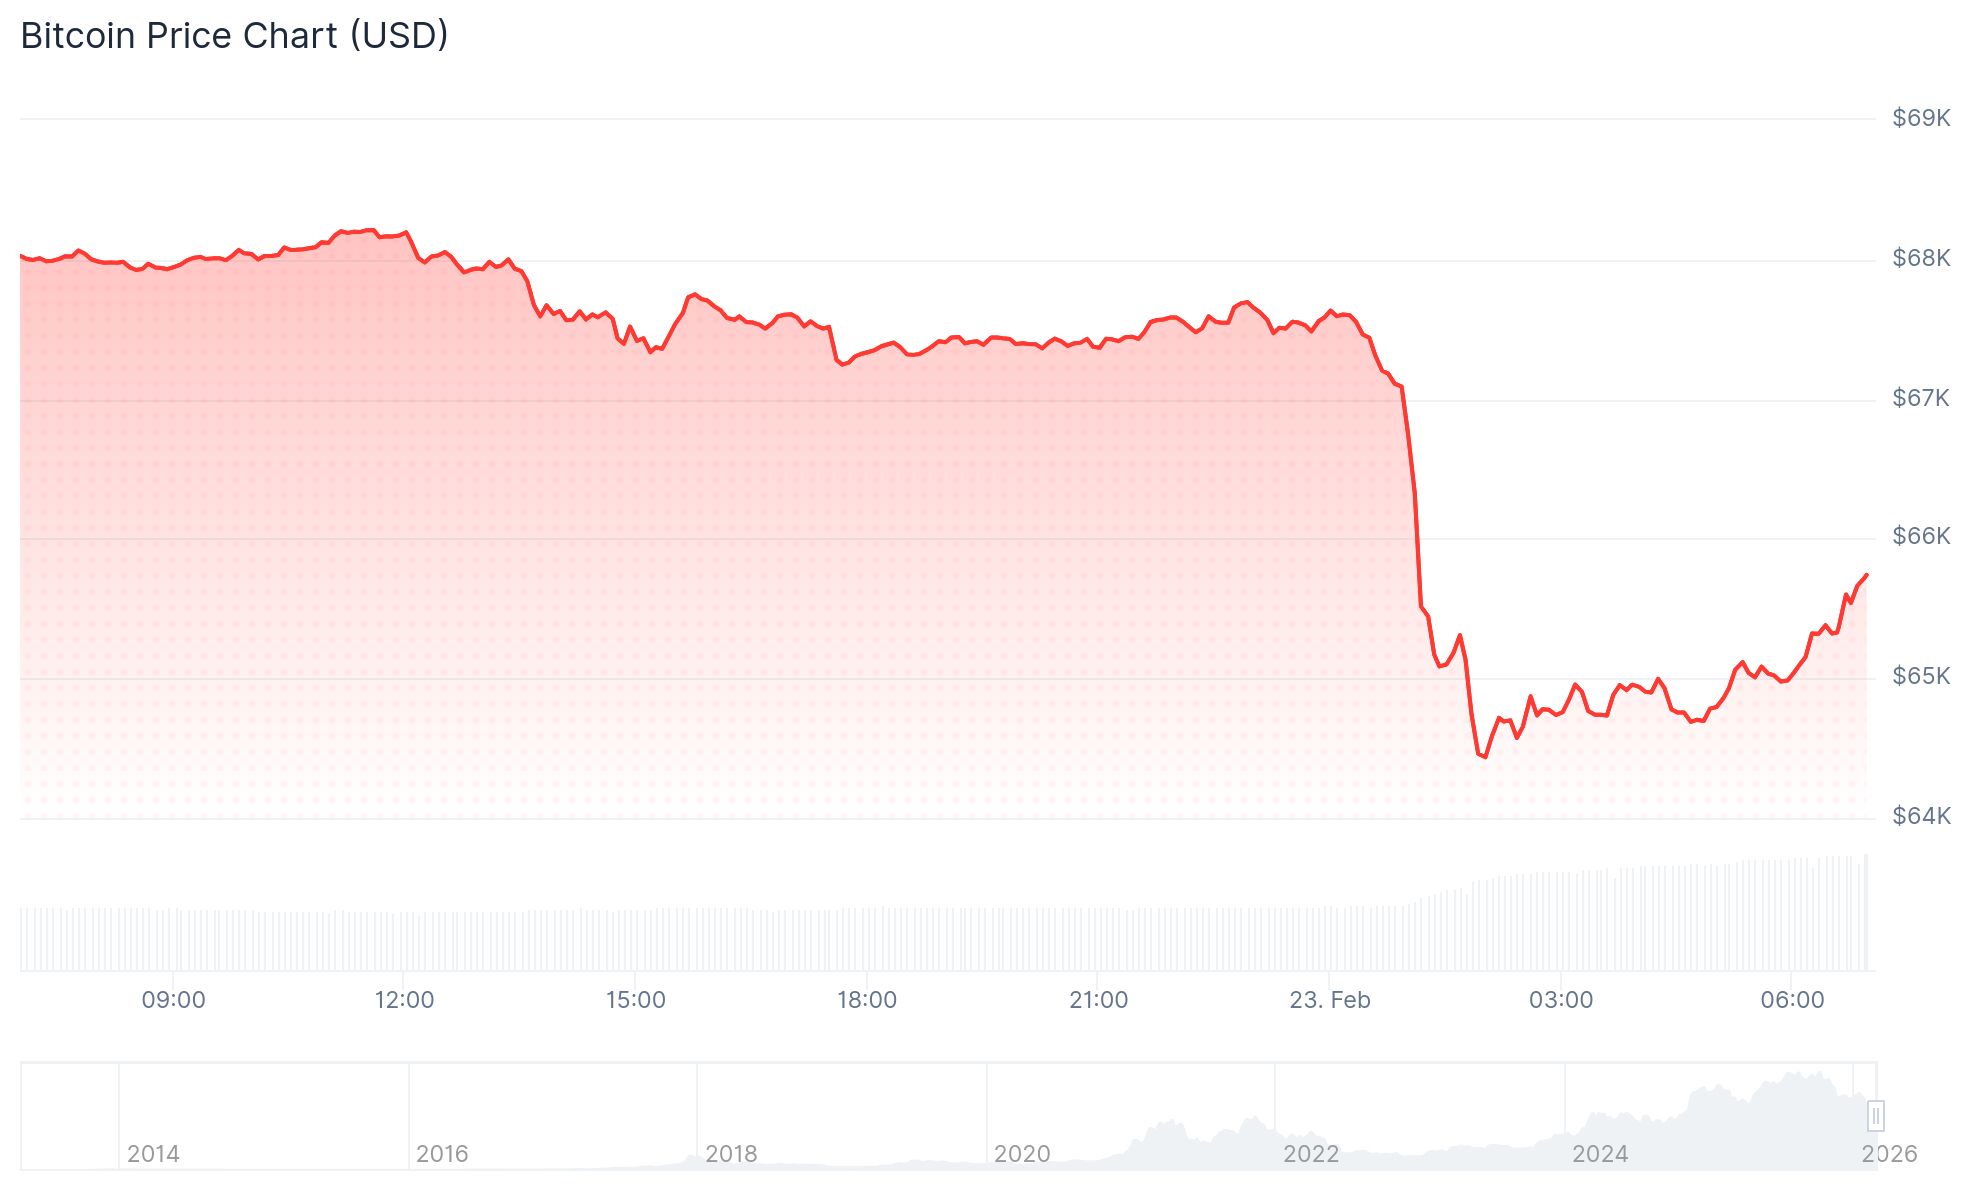
- Bitcoin dropped 5% to around $64,300–$64,700, its lowest level since Feb. 6
- The Crypto Fear and Greed Index fell to 5 out of 100, signaling “extreme fear”
- Whale selling now makes up nearly two-thirds of bitcoin flowing onto exchanges
- US tariff uncertainty and macro pressure are adding to selling momentum
- Spot Bitcoin ETFs saw $3.8 billion in net outflows over five consecutive weeks
Bitcoin dropped sharply in early Monday trading, falling more than 4% to around $64,300. That marks its lowest price since February 6.
The drop wiped out gains made over the weekend, when BTC briefly touched $68,600 on Saturday. More than 136,000 traders were liquidated in 24 hours, with $458 million in total liquidations — 92% of which were leveraged long positions.
Bitcoin is now trading 48% below its all-time high of $126,000, set in October 2025. It also sits 5.5% below its previous 2021 bull-market peak of $69,000.
This is a phenomenal chart.
It shows the Sharpe Ratio for #Bitcoin in the short term.
The key takeaway: the Sharpe Ratio has dropped to -38.38, which historically has marked "Low Risk" accumulation zones. The red circles highlight every time the Sharpe Ratio dipped to similar… pic.twitter.com/Nwp7SkfVP4
— Michaël van de Poppe (@CryptoMichNL) February 21, 2026
The Crypto Fear and Greed Index dropped to 5 out of 100, its lowest reading since the index launched in 2018. It has only hit this level three times before: August 2019, June 2022, and earlier this month.
Fresh tariff news added fuel to the selloff. On Saturday, President Trump said he would raise his global tariff from 10% to 15%. That followed a Supreme Court ruling that struck down his use of emergency authority to impose tariffs, creating more policy uncertainty.
US stock futures fell alongside crypto. S&P 500 contracts were down 0.8% and the Nasdaq 100 dropped 1% in early Monday trading. Gold rose 2% and silver jumped 5.6%.

Whales Take Over Exchange Flows
On-chain data from CryptoQuant shows the exchange whale ratio has climbed to 0.64 — the highest since 2015. That means nearly two-thirds of bitcoin hitting exchanges is coming from the 10 largest deposits each day.
Average bitcoin deposit sizes have also risen to levels last seen in mid-2022, pointing to bigger players driving current selling activity rather than retail traders.
Total bitcoin sent to exchanges peaked at around 60,000 BTC per day during the early February drop. That figure has since fallen to about 23,000 BTC on a 7-day average.
ETF Outflows and Thin Liquidity
US-listed spot Bitcoin ETFs recorded their fifth consecutive week of net outflows, with $3.8 billion pulled in that stretch — the longest outflow streak since February 2025.
From February 16 to February 20 (ET), Bitcoin spot ETFs recorded net outflows of $316 million, Ethereum spot ETFs saw net outflows of $123 million, while Solana spot ETFs posted net inflows of $14.31 million and XRP spot ETFs recorded net inflows of $1.8446 million.… pic.twitter.com/TYQfK5Jmxv
— Wu Blockchain (@WuBlockchain) February 23, 2026
Net USDT inflows to exchanges have shrunk from a one-year high of $616 million in November to just $27 million, briefly turning negative in late January. Stablecoin inflows typically grow during rallies, so their contraction points to reduced buying power.
The 7D-EMA of Net Realized Profit & Loss for recent investors plunged to –$1.24B/day on Feb 06, before moderating to –$0.48B/day today.
While the intensity has cooled, the broader regime still signals a market under pressure, with participants in the base formation phase… https://t.co/rhCsrDuDfJ pic.twitter.com/00zibdP1om— glassnode (@glassnode) February 23, 2026
Short-term holders were realizing losses of $1.24 billion per day on February 6. That figure has since eased to around $480 million per day, according to Glassnode.
Analyst Rachael Lucas from BTC Markets noted that $65,000 is a key support level. “A decisive break below that brings $60,000 into play,” she said.
Bitcoin was trading at approximately $65,000 as of early Monday afternoon in Singapore.


