


 Price: Analyst Says Epic Rally Could Be Coming — Here’s Why")


TLDR
- DOGE is trading near $0.094, forming a descending triangle since its 2021 peak
- Key resistance sits at $0.10; a break above could open targets of $0.20–$0.30
- Elliott Wave analysis suggests DOGE may be completing a final corrective leg near $0.093–$0.094
- Analyst Javon Marks identifies a hidden bullish divergence that could target $0.44
- On-chain data shows 60,000–110,000 daily active addresses, suggesting stable network activity
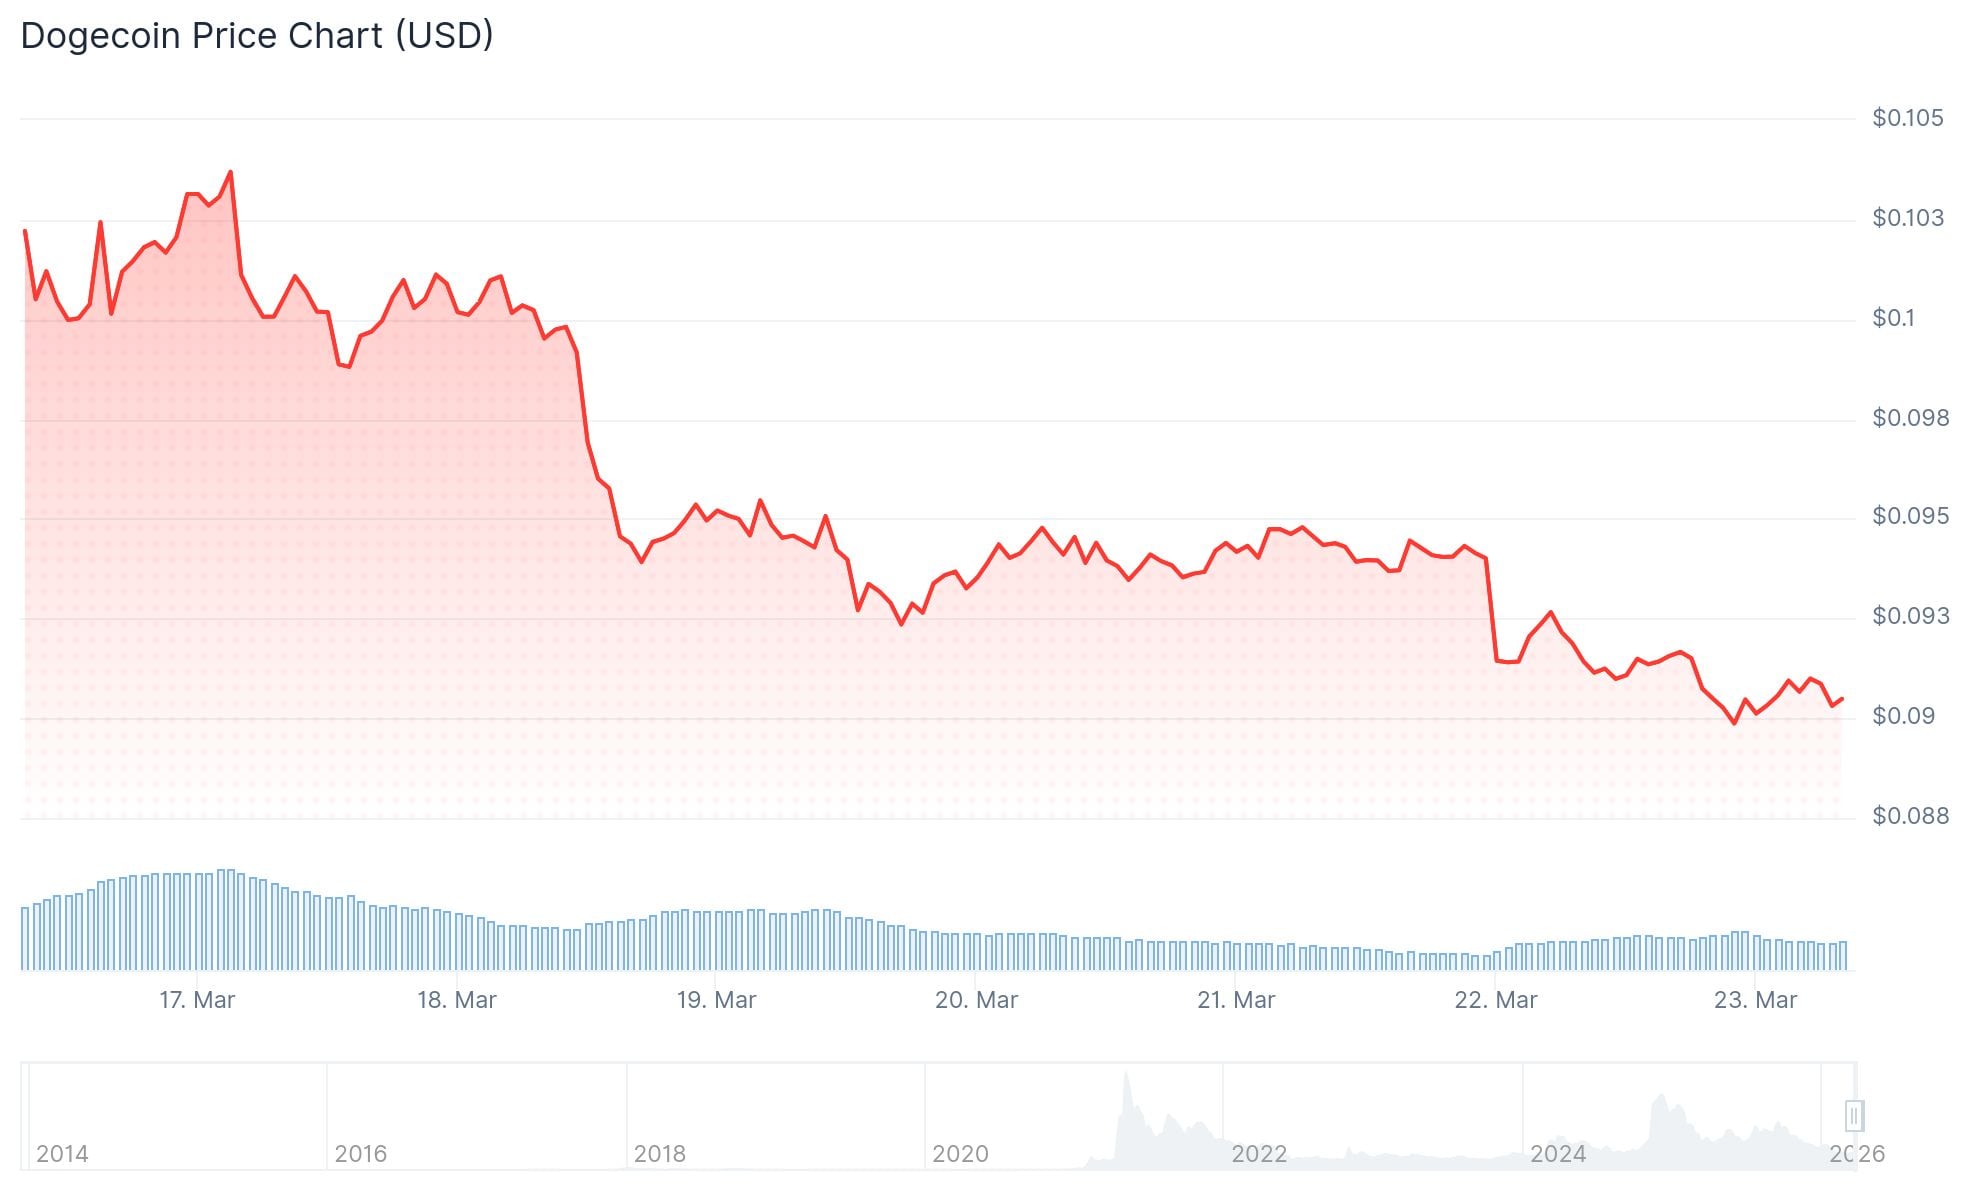
Dogecoin (DOGE) is trading near $0.094 as of March 21–22, 2026, locked inside a multi-year technical compression pattern that traders are watching closely.
Since its May 2021 all-time high of $0.73, DOGE has declined roughly 73% and entered an extended consolidation phase. On the weekly chart, a sequence of lower highs has formed a descending triangle, with support holding between $0.055 and $0.08.
Technical analyst CryptoPatel highlighted this structure, noting that DOGE sits near the upper boundary of a long-term compression zone. The pattern suggests that volatility has contracted as selling pressure slows.
THIS $DOGE Setup Could Create The Next Wave Of Crypto Millionaires
Massive Descending Triangle Forming Since The 2021 Peak.
Price Is Now Sitting At The Accumulation Zone Near $0.08-$0.055… The Tightest Compression In DOGE History.Breakouts From Patterns Like This Have… pic.twitter.com/LPr41NVHVc
— Crypto Patel (@CryptoPatel) March 21, 2026
Analyst Crypto Lens points to a 5-year demand zone near $0.07867. Previous breakouts from similar structures produced gains of +173%, +180%, and +421%, though past results do not guarantee future outcomes.
Elliott Wave and Hidden Divergence
Some analysts are reading the structure through Elliott Wave theory. In this view, DOGE may be completing the fifth and final leg of a corrective decline, with a Fibonacci target zone between $0.093 and $0.094.
If this wave completes near current levels, buyers could begin testing resistance at $0.098–$0.10.

With $DOGE's momentum oscillator making lower lows and its price currently holding higher lows, this can be seen as a Hidden Bull Divergence and it could be suggesting here a strong possibility for a huge continuation!
A continuation which can lead prices over +350% above $0.44.… pic.twitter.com/ZfSQQfB22h
— JAVON⚡️MARKS (@JavonTM1) March 21, 2026
Separately, analyst Javon Marks has identified a hidden bullish divergence forming near the $0.093–$0.095 range. Price is holding higher lows above $0.09, while the momentum oscillator prints lower lows — a signal often associated with weakening bearish pressure.
Marks suggests that if this divergence plays out, DOGE could rally more than 350%, targeting levels above $0.44 from around $0.093.
Key Levels to Watch
TradingView indicator summaries still show a “Sell” bias across moving averages. Oscillators including RSI and Stochastic remain mostly neutral.
Traders are watching these levels:
- Resistance: $0.095 and $0.098
- Psychological level: $0.10
- Support: $0.092 and $0.088–$0.090
A weekly close above the descending trendline, combined with volume expansion, would be the clearest confirmation signal. Chart projection methods suggest a breakout above $0.10 could imply targets in the $0.20–$0.30 range.
On-chain data from Glassnode and IntoTheBlock shows daily active addresses between 60,000 and 110,000, with daily transactions ranging from 80,000 to 200,000.
As of March 22, 2026, DOGE was trading at $0.09191, down 2.81% over the prior 24 hours. The $0.09 support level remains the key structural floor traders are monitoring.


