


TLDR
- XRP is trading around $1.43–$1.45, up roughly 1.2% in the last 24 hours
- Key resistance sits at $1.44–$1.50, with support holding near $1.35
- A Gartley harmonic pattern is nearing completion, with a projected target of $2.64
- A symmetrical triangle is tightening on the daily chart, hinting at a sharp move ahead
- Analyst EGRAG CRYPTO sees a potential initial breakout target of $2.30 once macro resistance clears
XRP is trading in a narrow range as technical patterns begin to stack up. Analysts are watching closely for a breakout signal.
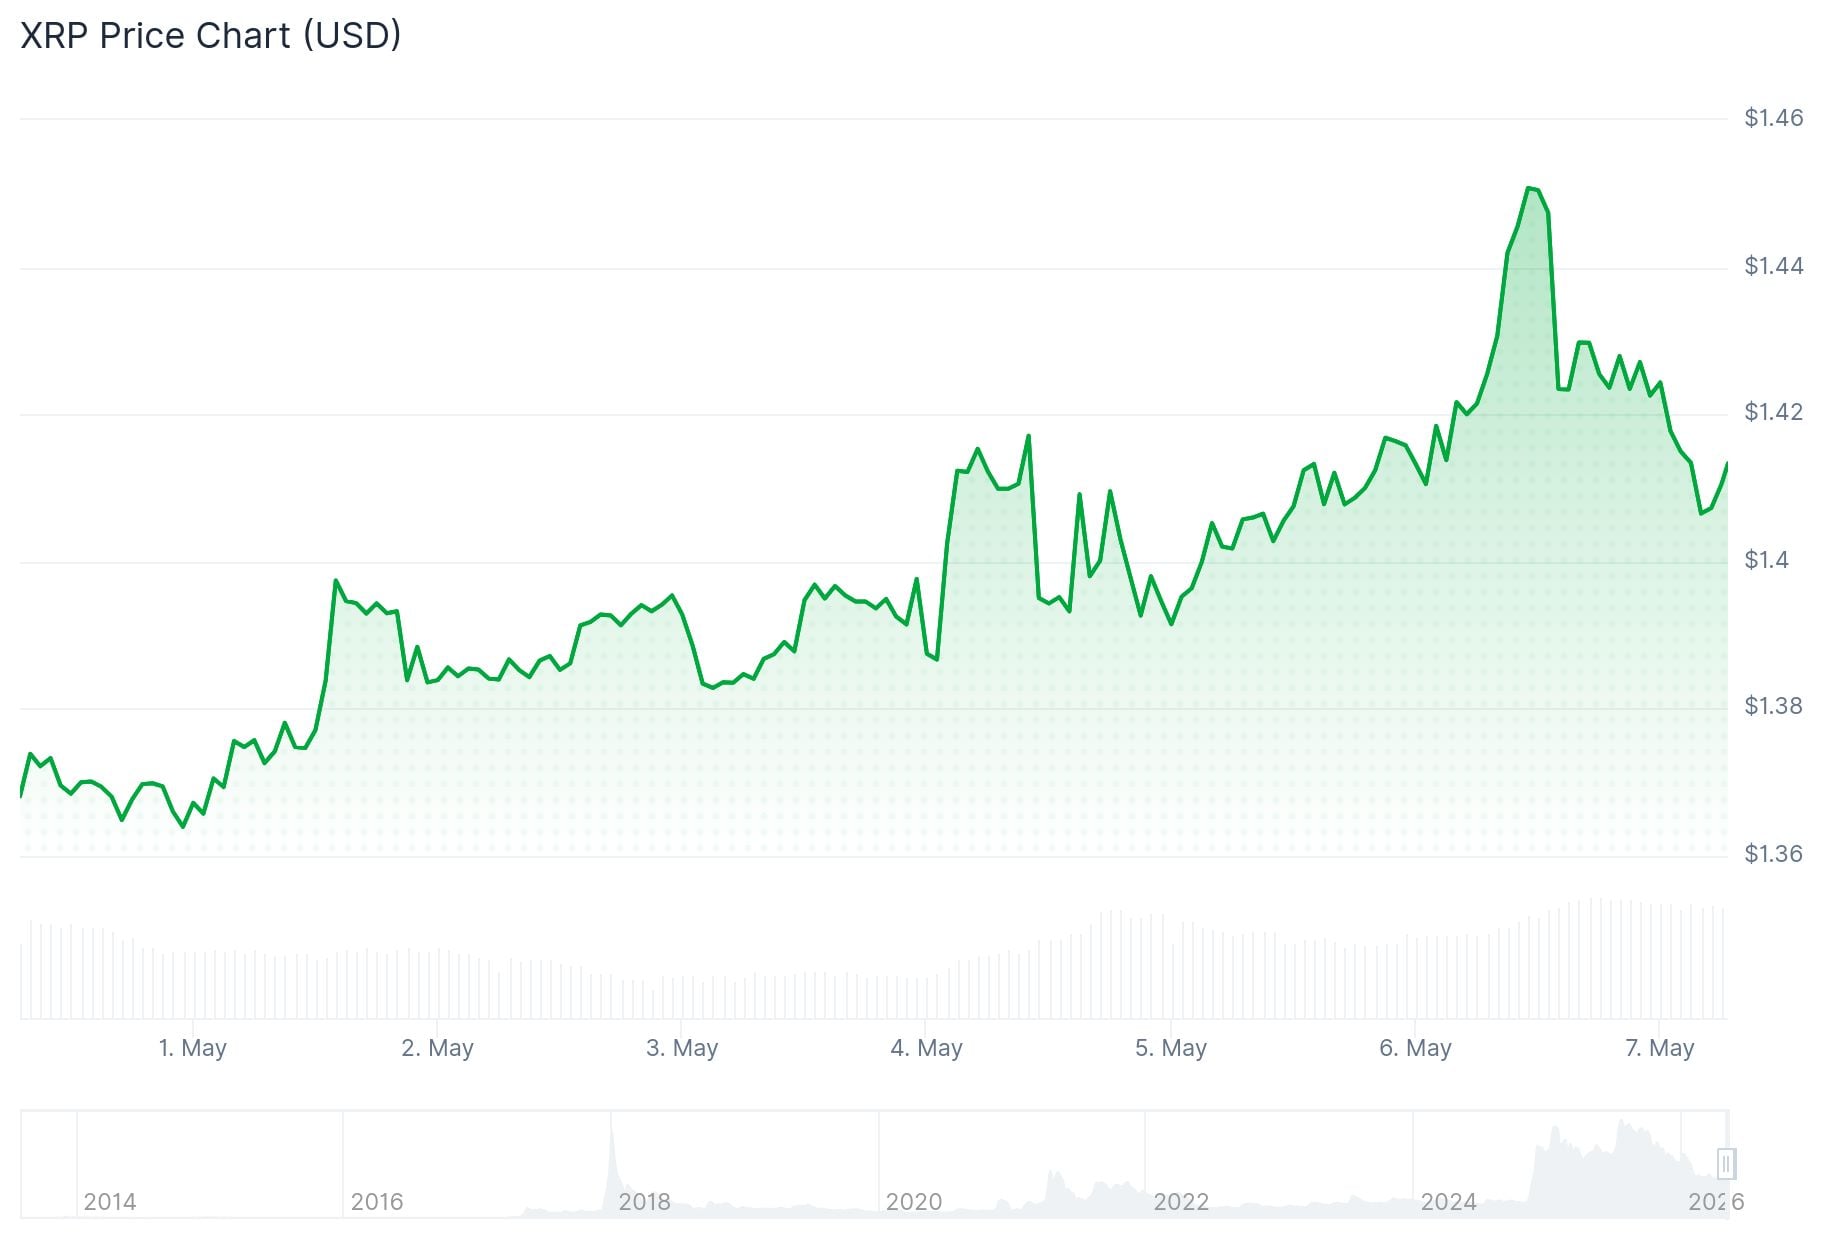
XRP, used widely for cross-border payments due to its speed and low fees, is currently hovering between $1.43 and $1.45. The past 24 hours have seen a modest gain of about 1.2%, but the bigger story is what chart patterns are forming beneath the surface.
The price has been consolidating above the mid-Bollinger Band on the daily chart. This zone has acted as dynamic support, keeping bulls in control for now. The upper Bollinger Band at $1.46–$1.47 is the immediate wall XRP needs to clear.
MACD momentum is slowly building. It has not yet confirmed a clean breakout, but the early signs of a bullish crossover are there. Trading volume remains moderate, which analysts typically associate with accumulation rather than distribution.
A Harmonic Pattern With a Big Target
Market observer The_Alchemist_Trader_ identified a Gartley harmonic pattern on the XRP chart. The pattern is nearing its final C-D leg, and if it completes as expected, it projects a target near $2.64. The analyst stated: “The harmonic structure is approaching its final phase, and holding the current support zone is critical for continuation.” A breakdown below the current support zone would invalidate this setup entirely.
Separately, analyst EGRAG CRYPTO pointed to a tightening symmetrical triangle on the daily chart. This type of pattern usually signals a sharp price expansion is coming. EGRAG CRYPTO noted the setup “could lead to a strong breakout once macro resistance levels are cleared,” with an initial target of around $2.30. A false breakout remains a risk, where price could spike before pulling back.
#XRP – TICK-TOCK… TIME IS RUNNING OUT ⏳
The symmetrical triangle on #XRP is becoming impossible to ignore. Price keeps compressing tighter and tighter, and historically this type of structure always leads to a violent expansion move. The measured targets are becoming crystal… pic.twitter.com/MwZh5njHNC
— EGRAG CRYPTO (@egragcrypto) May 6, 2026

Key Levels to Watch
The $1.44–$1.50 range has acted as a repeated supply zone. A confirmed close above this level would open the path toward $1.60 first, then potentially higher targets. On the downside, $1.35 is the critical support floor. Losing that could push price toward $1.32.
The RSI sits near 57 — not overbought, not oversold. Moving averages lean bullish on shorter timeframes, while oscillators remain neutral overall. The market shows a “Change of Character” pattern on the daily chart, which signals a potential trend transition without yet confirming direction.
This is a meaningful step toward 24/7 global financial markets.
By combining the XRP Ledger with global banking infrastructure, this pilot shows how institutions can execute cross-border transactions in a single integrated flow. https://t.co/H2mjgDSzvY
— Ripple (@Ripple) May 6, 2026
On the fundamentals side, Ripple has posted updates about growing involvement in tokenized assets and institutional cross-border settlements via the XRP Ledger. These developments support long-term sentiment, though they are unlikely to drive immediate price moves.
At press time, XRP is trading at approximately $1.45, sitting just below the key $1.46–$1.47 resistance zone.


