


 Price: The 200-Day Average Just Stopped BTC Cold — What Happens Next?")


TLDR
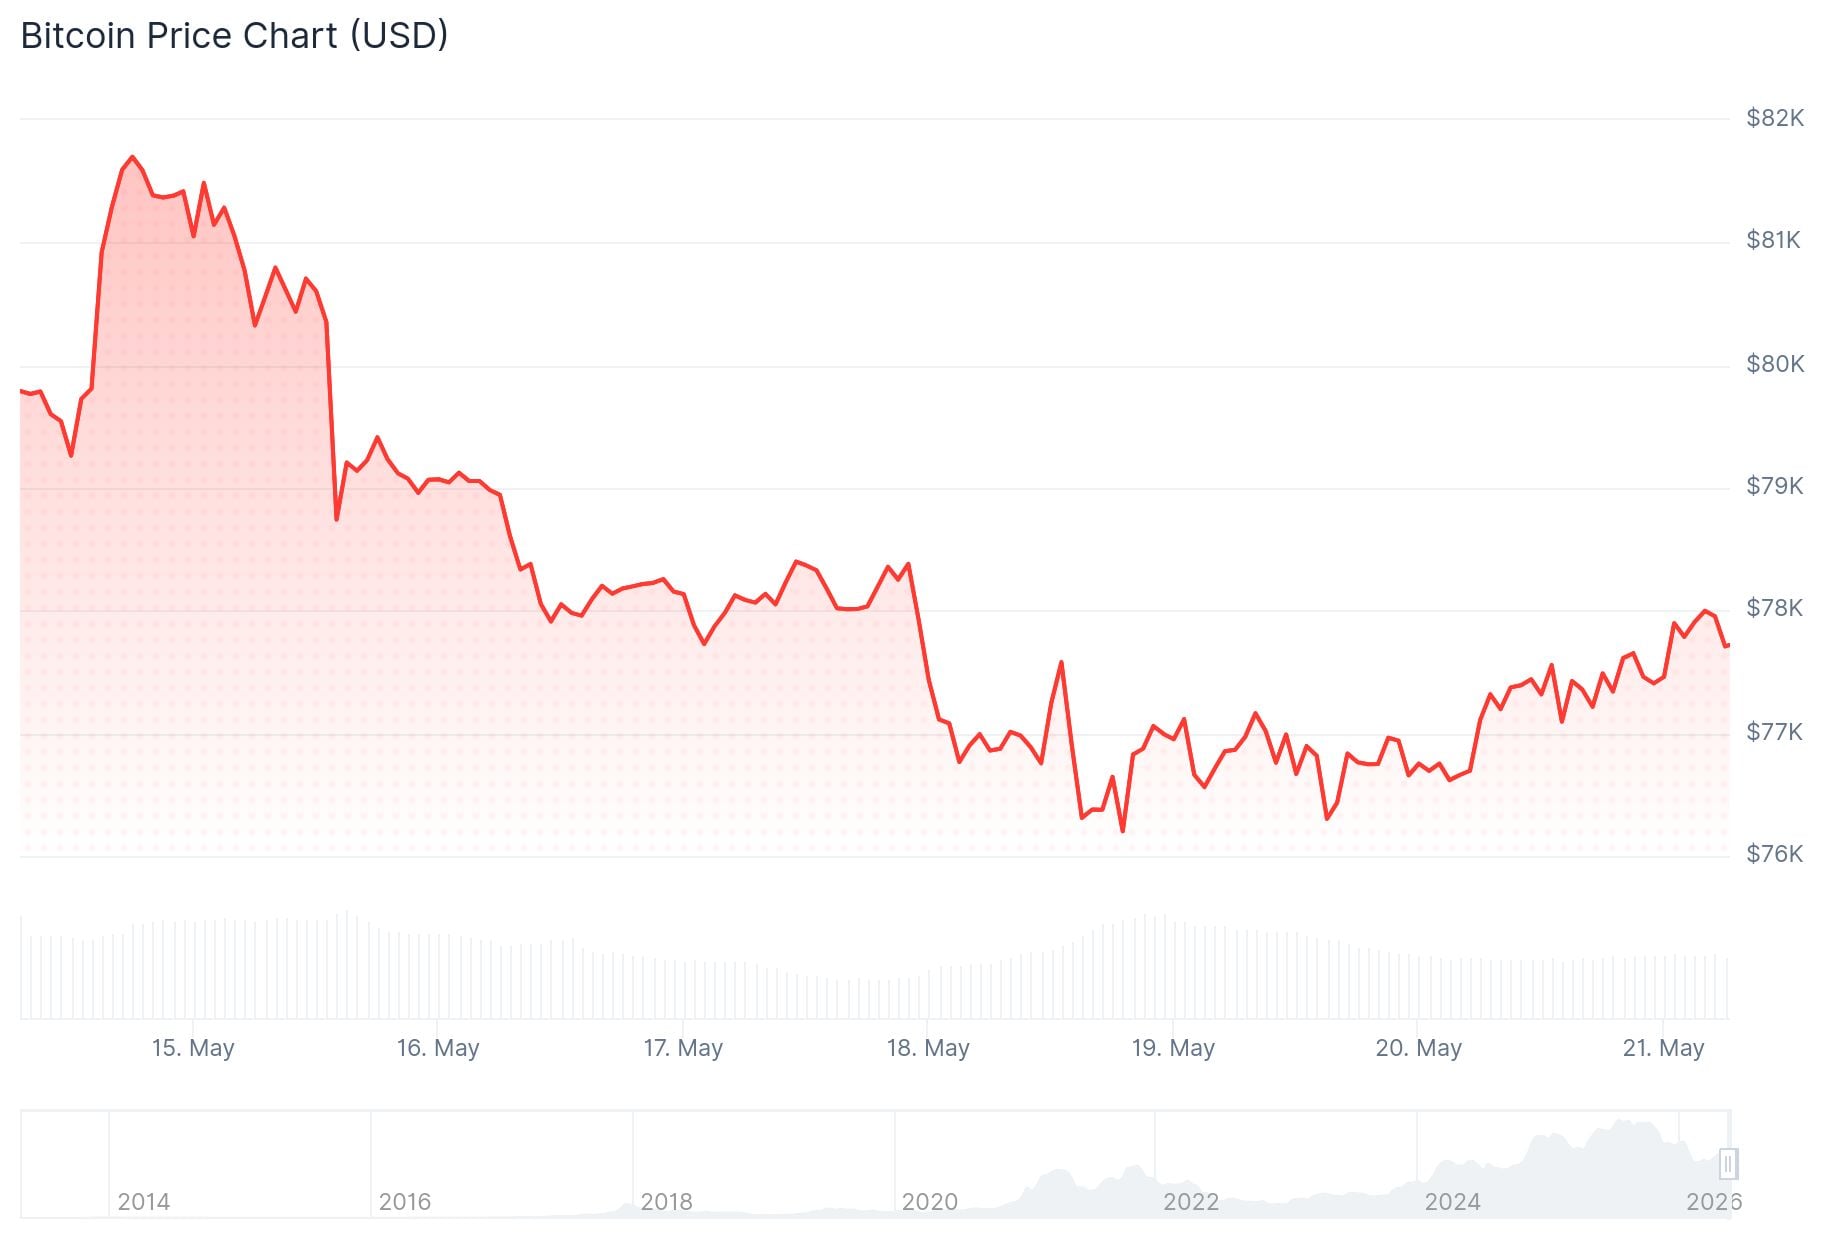
- Bitcoin failed to break above its 200-day moving average near $82,400, pulling back to around $77,900.
- CryptoQuant’s Bull Score Index has dropped to 20, which the firm labels “extremely bearish.”
- U.S. spot Bitcoin ETFs saw roughly $2 billion in outflows over the past two weeks.
- Demand signals from the U.S., South Korea, and Hong Kong are all soft.
- On-chain support at $70,000 is the next major level to watch if the drop continues.
Bitcoin’s rally from its February lows has run into trouble. After climbing toward $82,000, the price hit a wall at the 200-day simple moving average (SMA) and has since pulled back to around $77,900.
The 200-day SMA is closely watched by traders. It is often seen as the dividing line between a genuine recovery and a bear-market bounce. Failing to break above it has raised questions about whether the rally had real legs.
Analyst Ali Charts is watching the $77,800 level closely on lower timeframes. According to Ali Charts, Bitcoin has formed a channel on the 15-minute chart, and $77,800 is the ceiling. A confirmed close above that level could open the door toward $79,000. If it holds as resistance, the analyst expects a pullback toward $76,900 or the $76,000 range.
$77,800 is the key level to watch for Bitcoin $BTC.
I'm tracking a well-defined channel that has developed on the lower timeframes, specifically the 15-minute chart. Right now, Bitcoin has climbed to test the upper boundary of this structure around $77,800.
A clean breakout… pic.twitter.com/fz5YMN4M4C
— Ali Charts (@alicharts) May 20, 2026
Demand Is the Core Problem
Analytics firm CryptoQuant points to weakening demand as the main reason the rally stalled. The April and early May move higher was driven by three things: leveraged futures buying, spot demand, and U.S. ETF inflows. All three have since faded.
⚠️ ALERT: BITCOIN JUST FLASHED A MAJOR 2022 BEAR MARKET WARNING SIGNAL
Bitcoin was rejected at its 200-day moving average near $82K, a setup that CryptoQuant says closely mirrors the March 2022 bear market rally that preceded another major leg lower.
The firm warns that… pic.twitter.com/AszGEylKEe
— Coin Bureau (@coinbureau) May 21, 2026
CryptoQuant’s Bull Score Index fell from 40 to 20. The firm describes that reading as “extremely bearish,” matching levels seen in the February-to-March period when Bitcoin was trading between $60,000 and $66,000.

The Coinbase Bitcoin premium — which measures whether BTC trades higher on Coinbase than on offshore exchanges — has stayed negative through much of the rally and the subsequent pullback. A negative reading suggests U.S.-based buyers are not actively driving prices higher.
ETF Outflows and Weak Asian Demand
U.S. spot Bitcoin ETFs have now flipped to net sellers. According to SoSoValue data, the funds lost about $979.7 million in the week ending May 19, following nearly $1 billion in outflows the week before. That comes after six straight weeks of inflows that helped fuel the earlier advance.
Crypto ETF Flows — May 20 📊$BTC: -$70.5M net outflows$ETH: -$28.1M net outflows$SOL: $0.0M net flows
Bitcoin and Ethereum ETF outflows slowed, but demand has not fully bounced back yet 👀 pic.twitter.com/VzYAFsMBwr
— CoinCentral (@realcoincentral) May 21, 2026
ETF flow data for May 20 showed Bitcoin ETFs posting $70.5 million in net outflows and Ethereum ETFs seeing $28.1 million leave, with demand not yet fully recovering.
Korea’s kimchi premium, which tracks BTC demand on Korean exchanges, has dropped below zero. Hong Kong’s three spot Bitcoin ETFs have seen minimal volume through May, rarely clearing a few million dollars combined in a single day.
If the price continues lower, CryptoQuant points to $70,000 as the next key on-chain support. That level capped rallies in both October and January and currently represents the traders’ realized price on-chain.
Bitcoin is trading above $77,200 and the 100-hour simple moving average, with near-term resistance at $78,300 and then $79,000.


