






TLDR
- XRP dropped to a key support level of $1.2710 on May 28, its lowest point since February.
- A triple-bottom pattern and hammer candlestick are forming, which traders often read as bullish reversal signals.
- XRP ETF inflows hit $118 million this month, outperforming both Bitcoin and Ethereum ETFs.
- Analyst ChartNerd warned that a break below $1.28–$1.24 support could open the door to $1.00.
- RLUSD stablecoin has reached $1.8 billion in market cap, with volume up 61% month-over-month.
XRP fell sharply this week, touching a key support level that has held multiple times in 2025. The token hit $1.2710 on May 28, a price point that also acted as a floor in February, and twice in April.
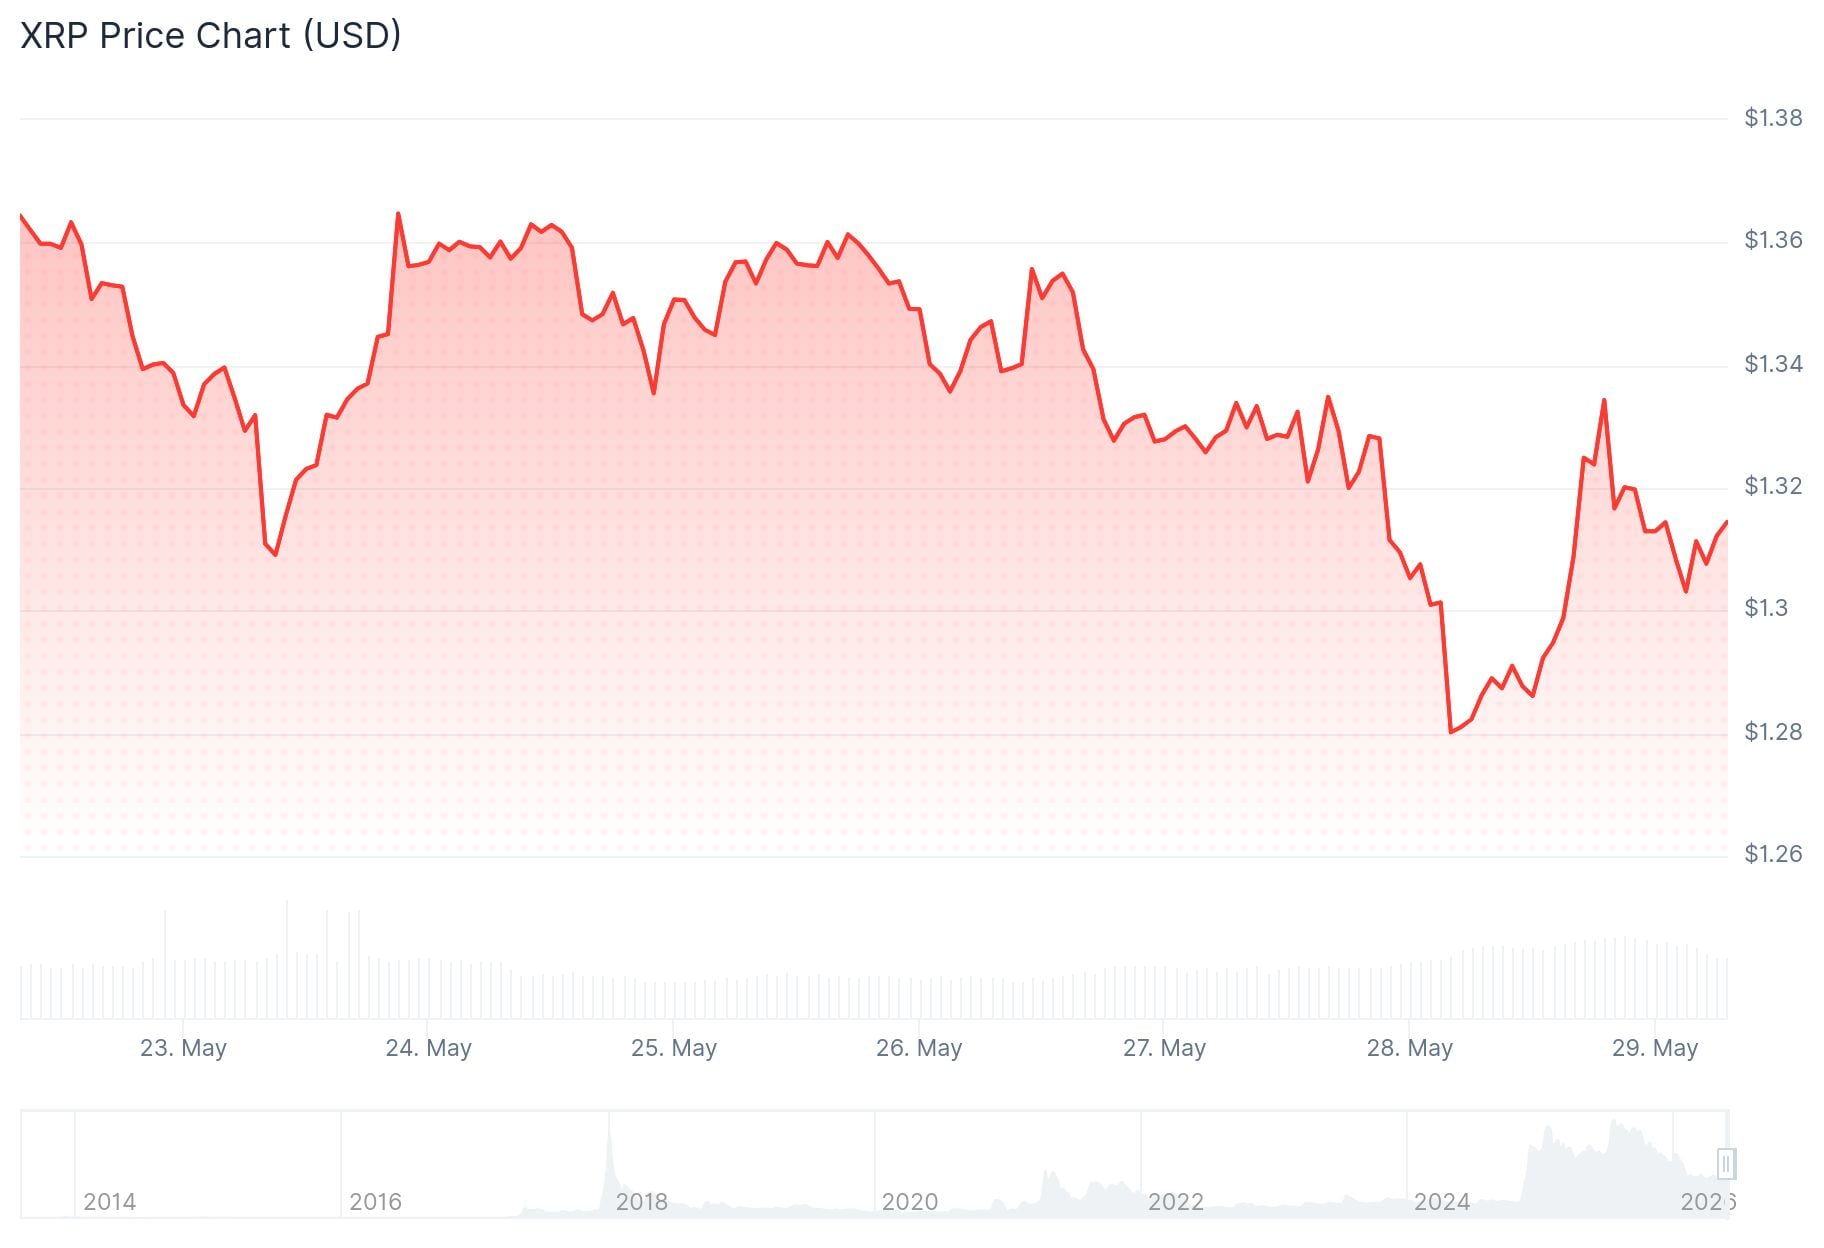
From a recent high of $1.5480 on May 14, XRP has dropped about 18% in two weeks. The decline happened alongside a broader crypto market pullback that also hit Bitcoin and other altcoins.
The price has since started to recover. By May 29, XRP climbed back above $1.29 before running into resistance near $1.32. It is currently trading below the 100-hourly simple moving average.
What the Charts Are Showing
Traders are watching the $1.2710 support closely. Three separate bounces from that level this year have formed what looks like a triple-bottom pattern, which technical analysts often view as a sign that selling pressure is fading.
A hammer candlestick is also forming on the daily chart, with a small body and a long lower shadow. This pattern frequently shows up before short-term price rebounds.
If XRP holds above $1.2710, traders see a path toward $1.50, roughly 15% from current levels. The key resistance levels to clear are $1.3280, then $1.3420, and then $1.3650.
Analyst ChartNerd posted on X: “$XRP has swept below the $1.30 guardrail and is now searching for the lowest daily candle close since early February. Current FIB support rests between $1.28/$1.24. It’s got to hold, or the $1 potential opens up sooner rather than later.” That warning puts extra weight on the current support zone.

$XRP has swept below the $1.30 guardrail and is now searching for the lowest daily candle close since early February. Current FIB support rests between $1.28/$1.24. It's got to hold, or the $1 potential opens up sooner rather than later. https://t.co/qhmXAfhi4R pic.twitter.com/Q3SbFcYLrp
— 🇬🇧 ChartNerd 📊 (@ChartNerdTA) May 28, 2026
If XRP breaks below $1.2720, the next downside targets are $1.2550 and then $1.2250. Below those, the year-to-date low of $1.1176 comes into view.
ETF Inflows and RLUSD Momentum
While the price has been under pressure, the underlying data has been more positive. Spot XRP ETFs have taken in $118 million this month, making it the best month for inflows in 2025 and the third-best since they launched.
JUST IN: ETF clients buy $1.77 million worth of $XRP, bringing total ETF-held net assets to $1.12 billion. pic.twitter.com/LhW8uMyAOk
— Whale Insider (@WhaleInsider) May 29, 2026
Bitwise’s XRP ETF alone has accumulated over $446 million in total inflows and holds $337 million in assets. A separate report noted ETF clients bought $1.77 million worth of XRP in a single session, bringing total ETF-held net assets to $1.12 billion.
By comparison, spot Bitcoin ETFs had over $2 billion in outflows this month, while Ethereum funds shed $401 million.
The Ripple USD stablecoin (RLUSD) has also continued to grow. It now holds a market cap of $1.8 billion, up from $697 million at inception. Adjusted trading volume hit $11.1 billion, a 61% rise month-over-month.
The price closed May 29 trading near $1.30, with bulls and bears watching the $1.2710 support line.


