


 Price: ETH Hits Fresh Lows As Institutions Pull Back For Third Week Running")


TLDR
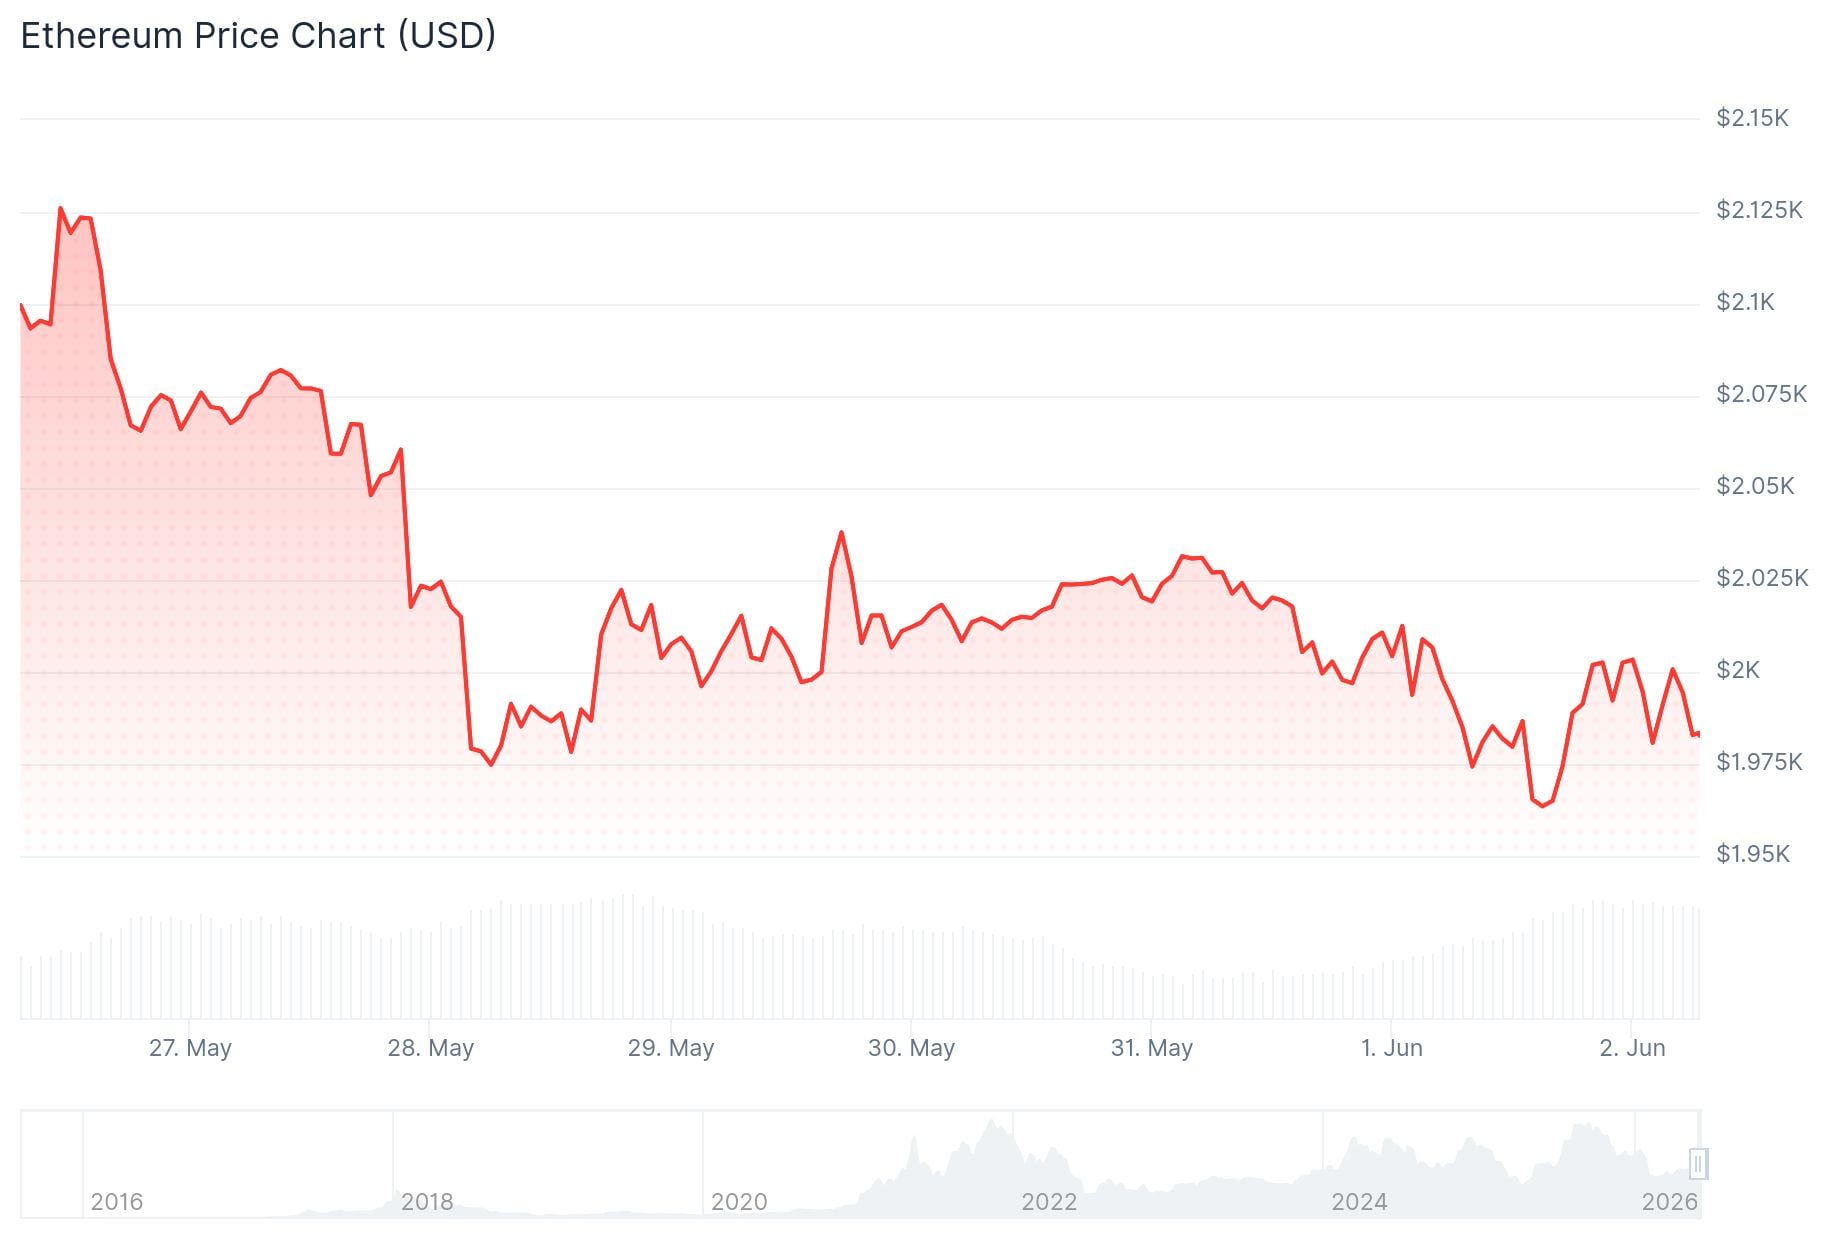
- Ethereum dropped below $2,000, hitting a low of $1,955
- BitMine purchased 26,497 ETH last week — its third-lowest weekly buy since adopting an ETH treasury model
- BitMine’s ETH holdings are underwater by roughly $9 billion
- US spot Ethereum ETFs recorded a third straight week of net outflows
- Key support sits at $1,909; a break below could expose $1,741
Ethereum is trading below $2,000 after fresh selling pressure pushed the price down to a low of $1,955. The token is struggling to hold ground as bears stay in control across multiple timeframes.
BitMine Immersion Technologies (BMNR) bought 26,497 ETH last week, bringing its total holdings to 5.41 million ETH, worth around $10.72 billion. That weekly purchase was the company’s third-lowest since it switched to an Ethereum treasury strategy in 2025.
BitMine’s Chairman Thomas Lee said the company is slowing its buying pace because it is already ahead of schedule in its goal to acquire 5% of ETH’s circulating supply. Lee also commented that current ETH prices do not reflect Ethereum’s improving fundamentals.
Despite that, the company’s ETH position is currently underwater by roughly $9 billion, according to data from CryptoQuant.
Analyst Rekt Capital pointed out on X that Ethereum has now monthly closed below its multi-year uptrend for the second time in five months. He warned that rallies from this trendline are weakening and that ETH needs to hold its 2026 lows or reclaim the trendline to avoid deeper downside.
Ethereum has Monthly Closed below its multi-year uptrend (green) for the second time in 5 months
The last time Ethereum Monthly Closed below the trendline, price produced a limited move to the upside and got rejected promptly
The rallies originating from this trendline… pic.twitter.com/tOoR6uf3yz
— Rekt Capital (@rektcapital) June 1, 2026
Institutional Outflows Adding Pressure
US spot Ethereum ETFs have seen net outflows for three consecutive weeks, per SoSoValue data. That points to sustained caution from institutional investors.

⚠️ BTC and ETH ETF outflows have hit record consecutive streaks: BTC ETF 11 straight days ($3.45B total), ETH ETF 15 straight days ($757M total). BTC fell from $81,710 to $70,111 (-14.2%) and ETH from $2,412 to $1,956 (-18.9%) during the streak.
𝗛𝘂𝗽𝘇𝘆 𝘁𝗮𝗸𝗲:… pic.twitter.com/ZBE5RtcryJ
— Hupzy (Spot On Chain) (@hupzy_agent) June 2, 2026
Strategy, the largest crypto treasury by holdings, also disclosed it sold 32 BTC last week for $2.5 million to fund preferred stock dividends. That sale adds to the broader picture of digital asset treasuries facing pressure.
Ethereum saw $106.3 million in liquidations over the past 24 hours. Long positions accounted for $90.3 million of that total, based on Coinglass data.
Key Price Levels To Watch
On the daily chart, Ethereum is trading below its 20-, 50-, and 100-day EMAs at $2,098, $2,172, and $2,269. That puts all three major moving averages above the current price, which typically signals a bearish trend.
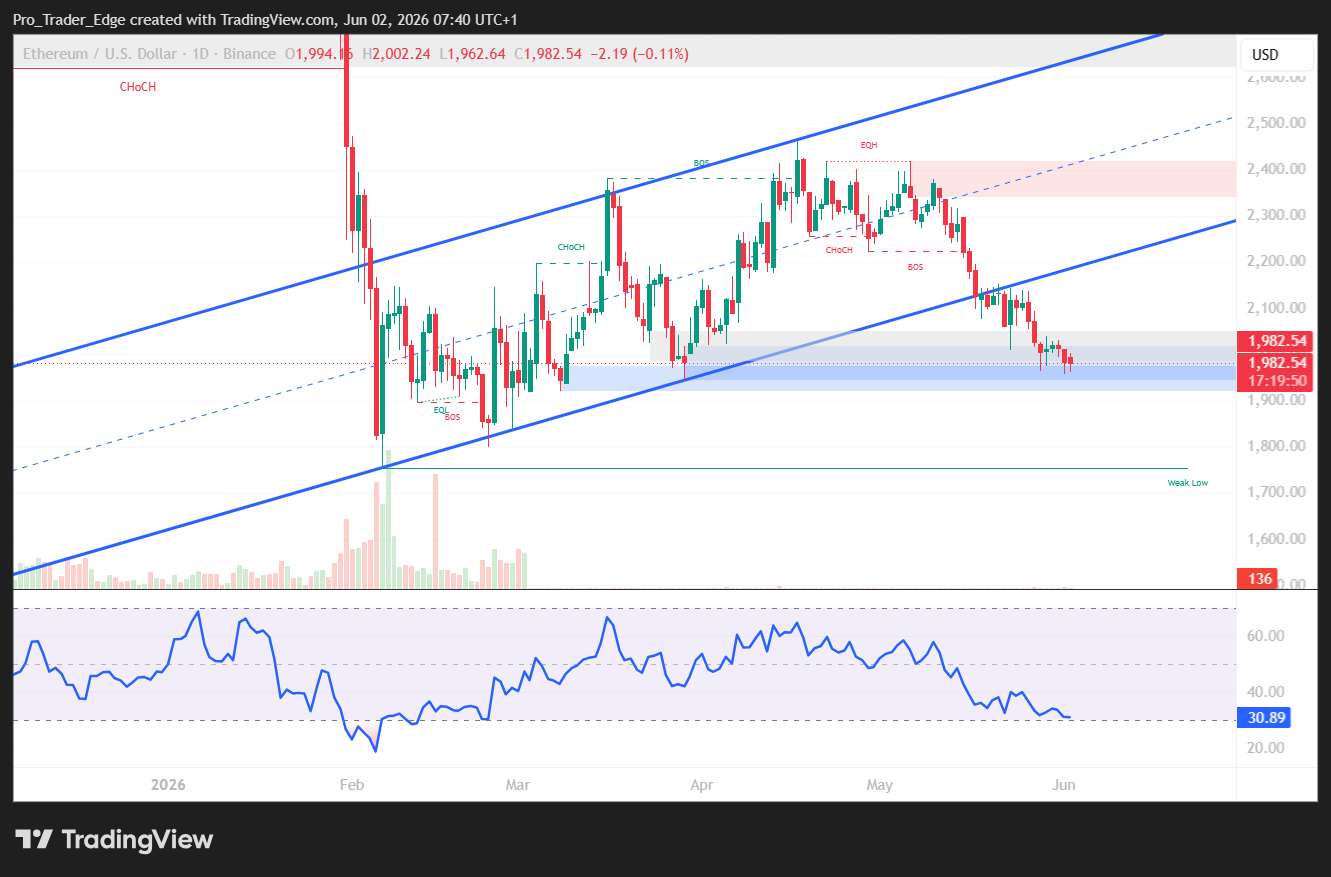
The 14-day RSI is hovering near 30 and the Stochastic Oscillator is deep in oversold territory. While that means selling pressure has been intense, it does not on its own signal a reversal.
On the upside, resistance levels sit at $2,000, $2,020, $2,050, and $2,080. Clearing $2,050 could open the door toward $2,120 or $2,150.
On the downside, the first support is at $1,955, followed by $1,920 and $1,909. A break below $1,909 would expose $1,741, with deeper levels at $1,524 and $1,404 if selling continues.
ETH was last trading around $1,980, below the 100-hourly Simple Moving Average, with a bearish trend line resistance forming near $2,010 on the hourly chart.


