






TLDR
- ETH is holding above $1,825 after breaking key resistance, with bulls targeting $2,500
- U.S. spot Ethereum ETFs posted a second straight week of net inflows totaling $105.44 million
- Total Ethereum ETF assets reached $9.97 billion, just shy of the $10 billion milestone
- ETH/BTC is testing the upper boundary of a yearlong descending channel
- Analyst Ali Charts says $1,850 must hold for a move toward $2,300
Ethereum is trading around $1,865 after recovering from June lows near $1,505. The asset has been building higher highs and higher lows throughout July, and traders are now watching whether it can push past $2,000.
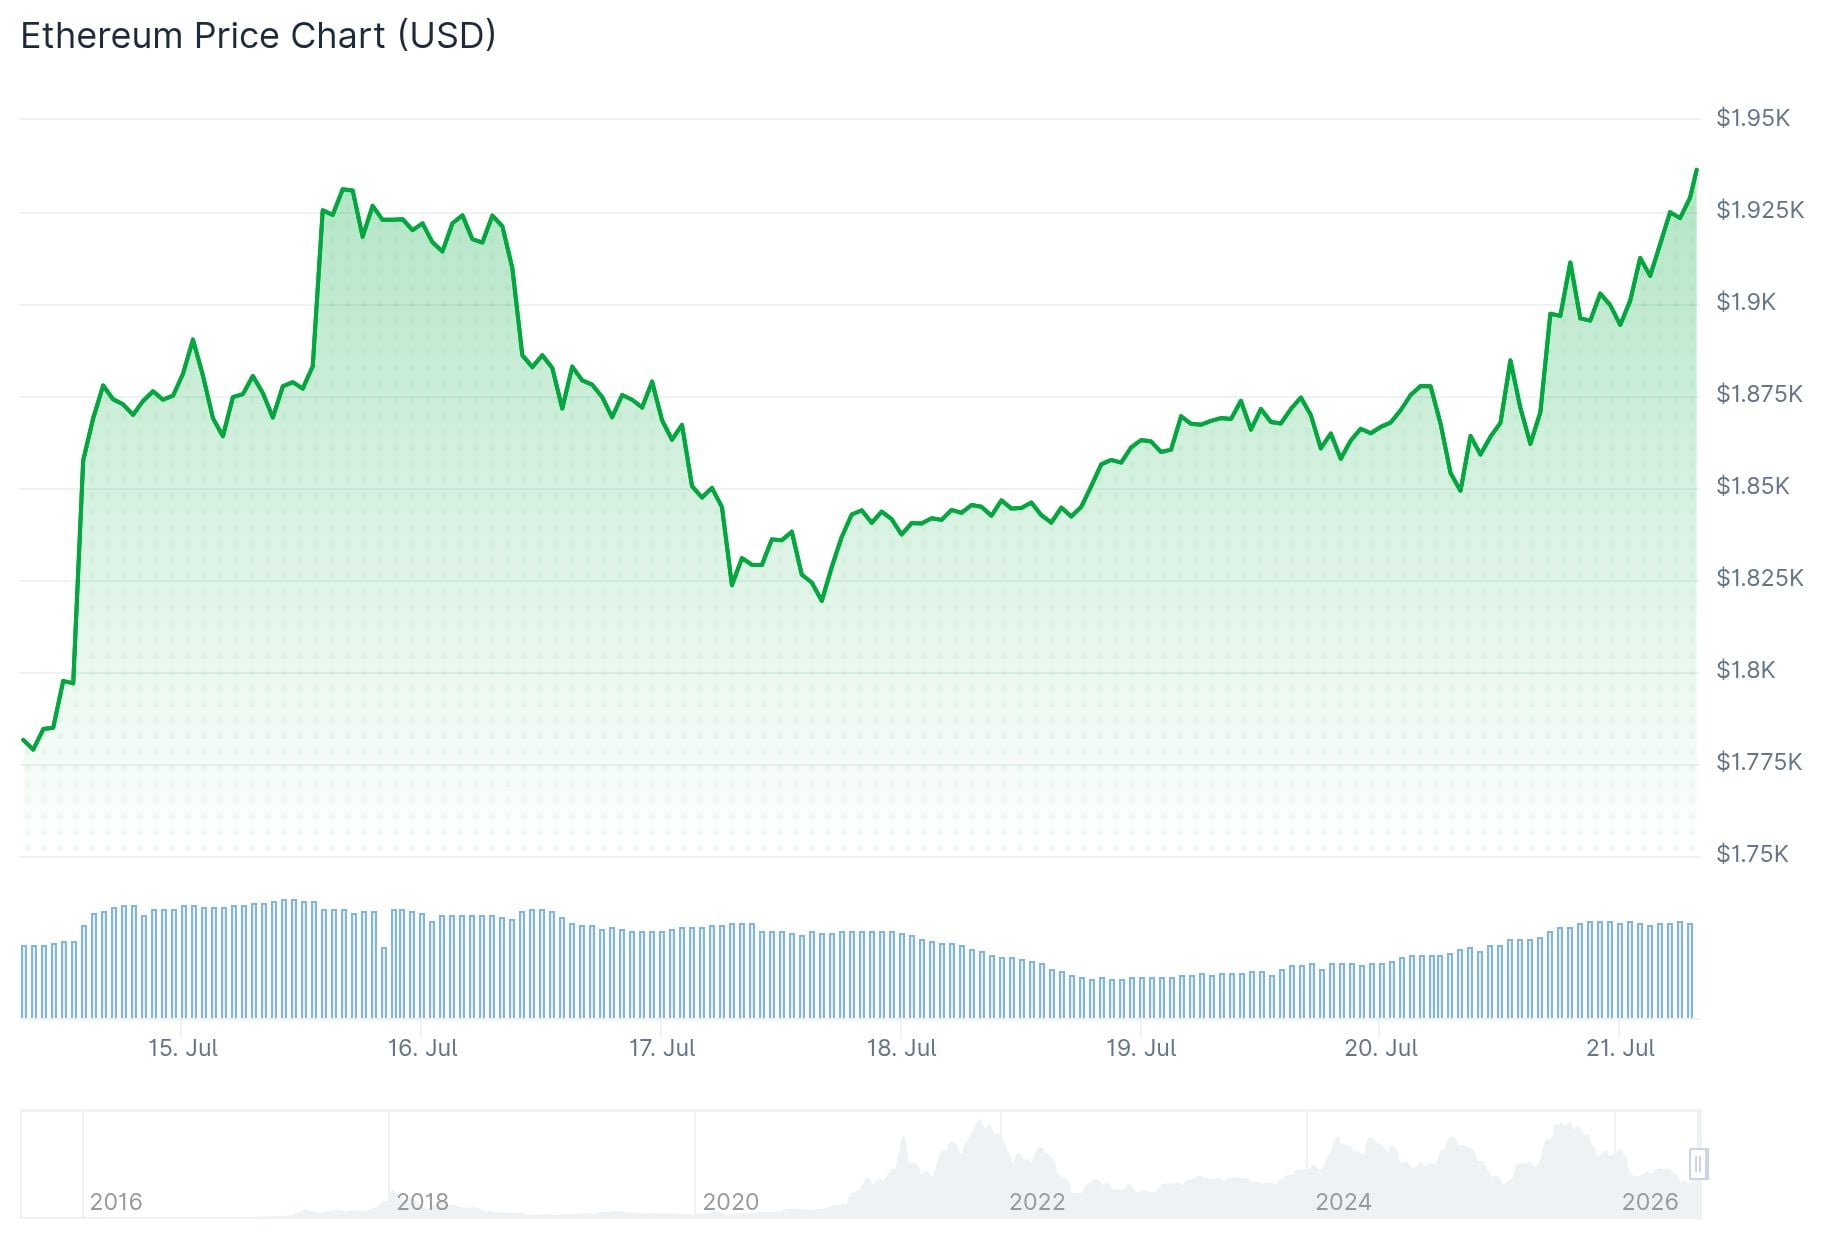
The immediate resistance sits at $1,900. A clean break above that level would bring the psychological $2,000 mark into focus, an area of previous supply that bulls need to clear to confirm the recovery.
If ETH holds $1,825 and continues forming higher lows, analysts see a path toward $2,465-$2,620. The broader target zone sits between $2,500 and $2,620.
Analyst Ali Charts posted that if Ethereum is forming a double bottom, the $1,850 level must hold. According to Ali Charts, as long as that support stays intact, $2,300 becomes the next upside target.
If Ethereum $ETH is indeed forming a double bottom, $1,850 is the level that must hold.
As long as support remains intact, $2,300 becomes the next upside target. https://t.co/eJeHAxpdrd pic.twitter.com/wRye59lACG
— Ali Charts (@alicharts) July 20, 2026
Analyst Ted Pillows added that ETH has reclaimed its 6-month downtrend and that weekly MACD has flipped bullish. He noted that investor Tom Lee and several institutions are still buying, and that a hold at $1,850 could lead to another 10% rally.
$ETH has reclaimed its 6-month downtrend, while weekly MACD has flipped bullish.
Tom Lee is still buying along with a few more institutions.
If $1,850 holds here, Ethereum is looking good for another 10% rally. https://t.co/Ac5thGWgHf pic.twitter.com/RNci9OO0in
— Ted (@TedPillows) July 20, 2026

ETF Inflows Signal Institutional Return
U.S. spot Ethereum ETFs recorded $105.44 million in net inflows for the week ending July 17, following $84.42 million the previous week. That ended five consecutive weeks of net outflows between mid-May and late June.
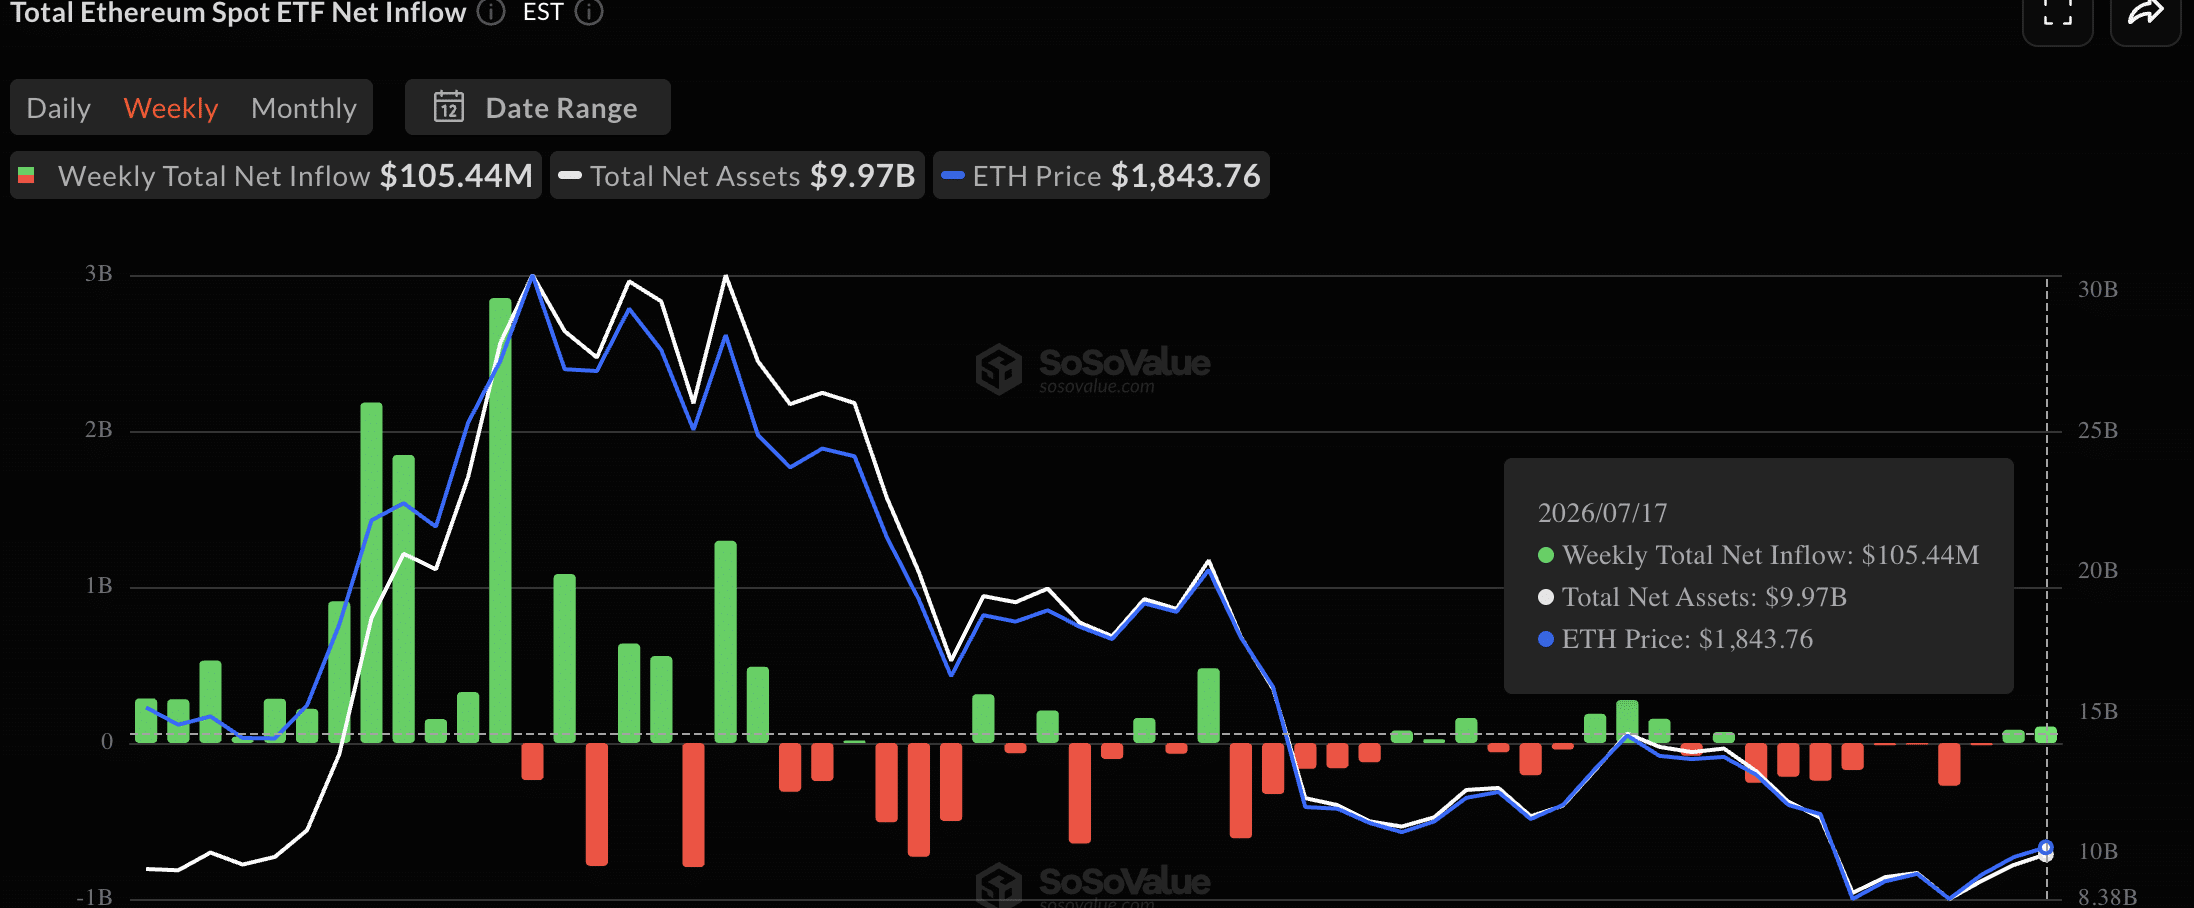
Cumulative net inflows now stand at $11.08 billion. Total ETF assets reached $9.97 billion, just below the $10 billion mark.
BlackRock’s ETHA led inflows with $31.68 million on July 17 alone and manages $5.22 billion in net assets, more than half the U.S. spot Ethereum ETF market. Fidelity’s FETH added $5.05 million.
ETH vs. Bitcoin: A Potential Shift
ETH/BTC is testing the upper boundary of a yearlong descending channel around 0.0285-0.029 BTC. The pair recovered from long-term support near 0.0262 BTC and a confirmed breakout could push it toward 0.030 BTC, then 0.032 BTC.
A sustained move higher in ETH/BTC could improve momentum across other tokens in the Ethereum ecosystem.
On the weekly chart, RSI sits around 40, showing improvement from oversold conditions but still below the neutral 50 level. On the daily timeframe, RSI climbed to 58.
The $1,800 level now acts as the first key support. BlackRock’s ETHA recorded $31.68 million in daily inflows on July 17, the most recent session with available data.


