






TLDR
- XRP is trading around $1.03–$1.04, with the $1.05 level now acting as resistance instead of support.
- Most major moving averages are pointing down, and the RSI sits near 38, close to oversold.
- The $1.00 level is seen as the next major support, aligning with a key Fibonacci retracement.
- Whale wallets are quietly accumulating XRP even as retail investors reduce exposure.
- Analyst Crypto Patel called a 72% drop from the cycle top and now eyes a $0.65–$0.85 accumulation zone.
XRP is trading around $1.03 on Friday, holding on to a thin ledge above the psychologically important $1.00 level. The token has been under steady pressure after slipping below the $1.05 support zone, which has now flipped into resistance.
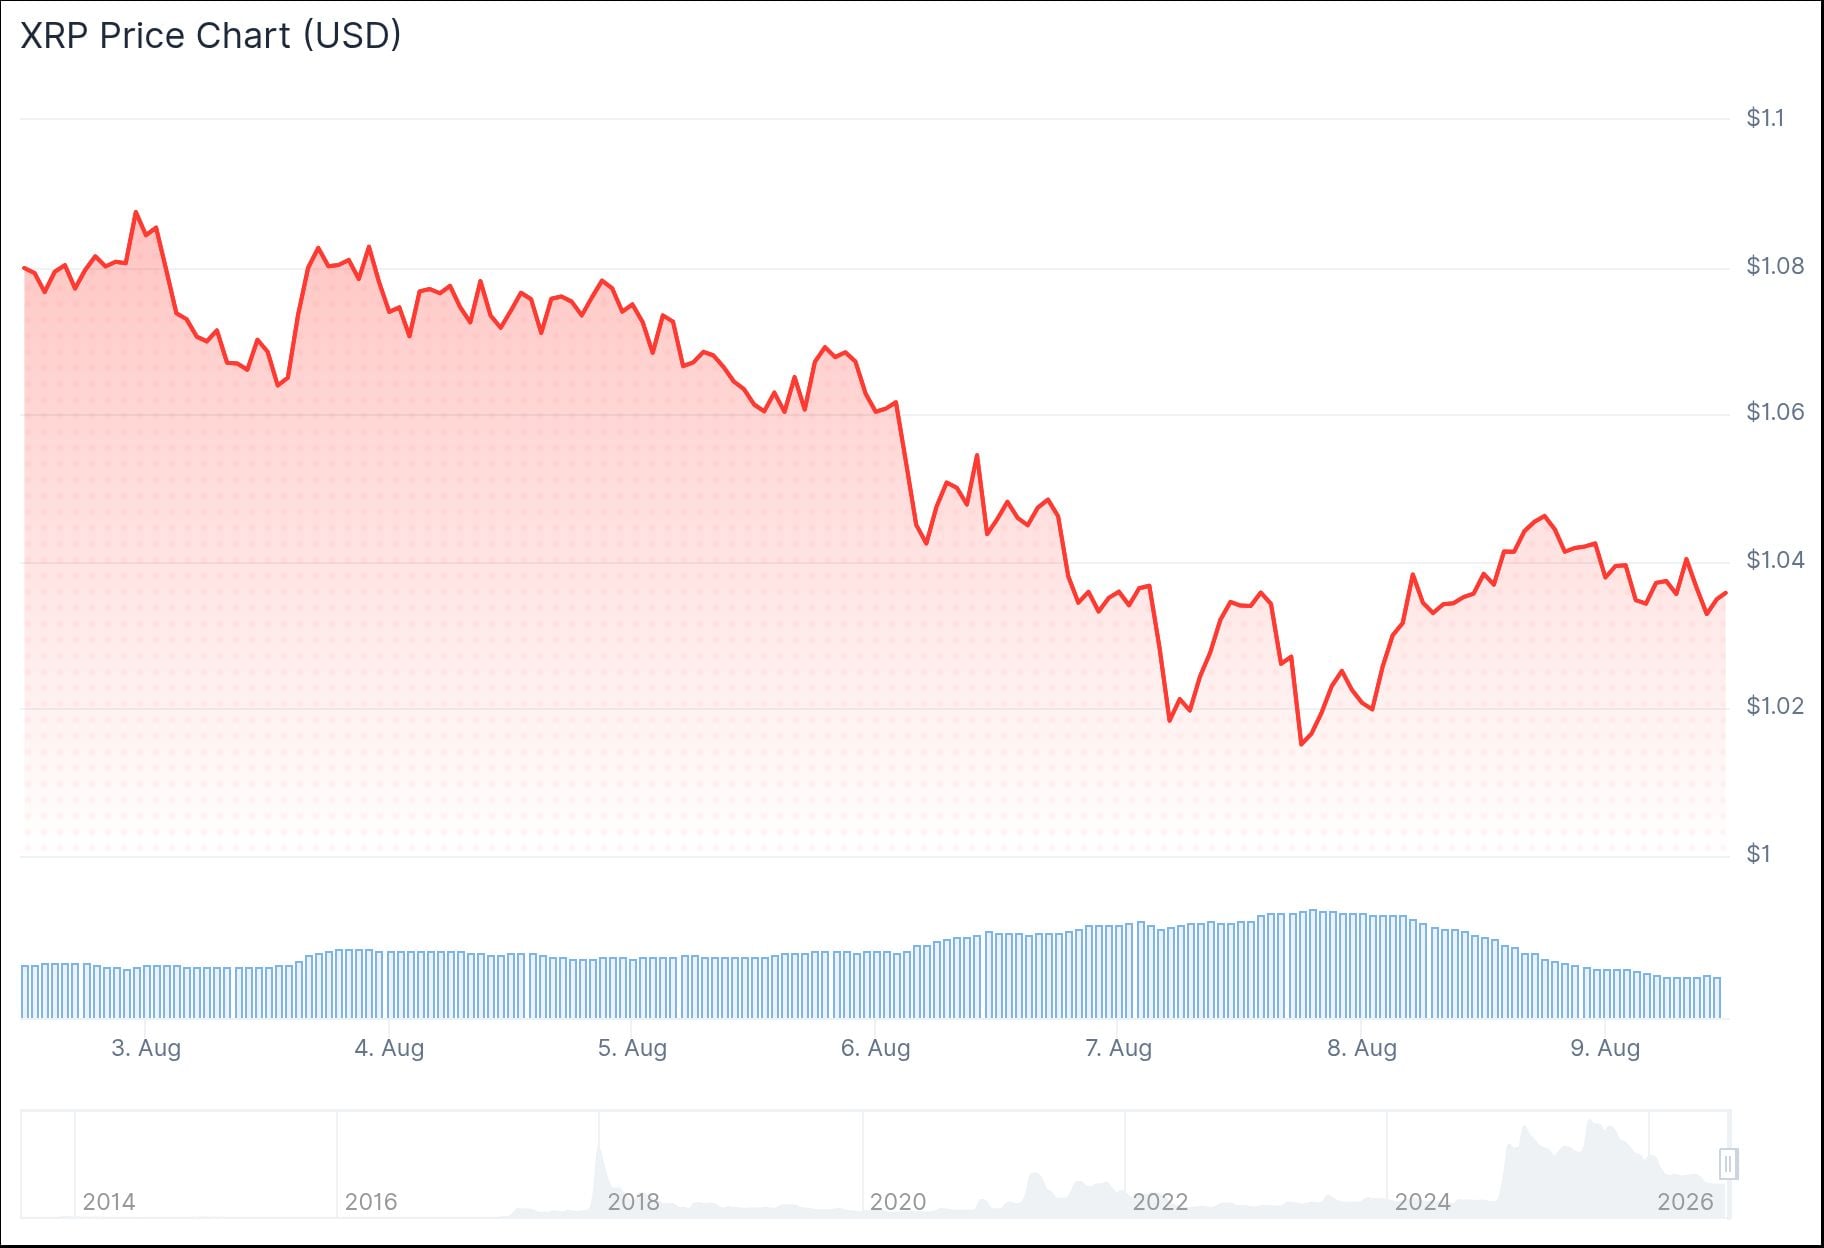
The price recently recorded its lowest daily close of 2026, near $1.02. That close came after XRP broke an ascending support trendline and retested its June lows, reinforcing the bearish trend that has been building for several weeks.
Analyst ChartNerdTA flagged the break on July 31, pointing to repeated rejections from the 20-day and 50-day EMAs and multiple failed attempts to reclaim the $1.16–$1.24 resistance zone. The analyst expects any recovery to remain short-lived unless XRP can clear those levels.
CONFIRMED! $XRP just printed its lowest daily close of the year while officially tagging back into the recent June low territory. This comes ahead of multiple 50 EMA rejections over the last 8/10 weeks, & a more recent rejection at the daily 20 EMA that opened this drop to $1.01. https://t.co/fIKecLhjlx pic.twitter.com/CI7kCFmJfu
— 🇬🇧 ChartNerd 📊 (@ChartNerdTA) August 7, 2026
On TradingView, another analyst identified a bearish Break of Structure after XRP lost the $1.0473 swing low. The 21-period EMA near $1.0527 and the 55-period EMA near $1.0669 are now acting as overhead resistance. A four-hour close above the 55 EMA would be needed to flip the outlook.
Why $1.00 Is the Line in the Sand
Independent analyst Rocksorgate described the $1.00 level as one of XRP’s most important long-term support zones. It aligns with the 0.618 Fibonacci retracement from XRP’s broader multi-year advance.
“If $1.00 snaps on high volume,” Rocksorgate wrote, “the bullish market structure breaks completely.”

The 50-day EMA sits at $1.11, clustered with the SuperTrend line. The 100-day EMA is at $1.19, and the 200-day EMA is at $1.39. All of these are above the current price and represent layers of resistance.
The RSI is hovering near 37–38, and the MACD remains in negative territory below its signal line. Nearly every major moving average from the 10-period to the 200-period EMA is generating a sell signal.
Whales Are Buying While Retail Sells
Despite the selling pressure, larger wallets are accumulating. Wallets holding between 100 million and 1 billion XRP now represent 11.79% of the circulating supply, up from 11.65% the day before, according to Santiment. Exchange balances are also declining, which suggests larger holders are moving tokens off exchanges.
Crypto Patel, a widely followed technical analyst, posted on August 8 that he had called XRP’s 72% drop from its cycle top back in July 2025 when most analysts were bullish. He now sees a macro accumulation zone between $0.65 and $0.85 and expects another 20%–40% downside before any major recovery. His long-term price targets are $3, $5, $7, and $10+.
$XRP: The Analysis Everyone Laughed At… Until It Dumped 72%
In July 2025, when most of the market was calling for higher prices, I published a bearish #XRP analysis and clearly stated that the rally was losing structure. I advised taking profits above $3 and warned that a… https://t.co/AGHdYcGUHg pic.twitter.com/aUkxE6fZSQ
— Crypto Patel (@CryptoPatel) August 8, 2026
The Fear & Greed Index currently reads 29, sitting in Fear territory, up slightly from 25 the day before.
The first support zone sits near $1.026, with stronger support around $0.99. The next liquidity target identified by analysts is $1.015.


