






TLDR
- SUI is trading around $0.7246, up 0.33% on the day with a market cap of $2.97 billion
- Price is pressing against a descending trendline resistance near $0.74, with sellers showing signs of exhaustion
- A confirmed close above $0.7641 would open the door to $0.9564, then the psychological $1.00 level
- Long liquidations dominated the past 24 hours at $525,940 vs just $75,160 in shorts
- Analyst Ali Charts says the TD Sequential is flashing a buy signal on the daily chart, pointing to a potential 1–4 candle rebound
Sui (SUI) is trading at approximately $0.7246, up 0.33% on the day according to CoinGlass data. The token has a circulating supply of 4.09 billion SUI out of a total of 10 billion, giving it a market cap of $2.97 billion.
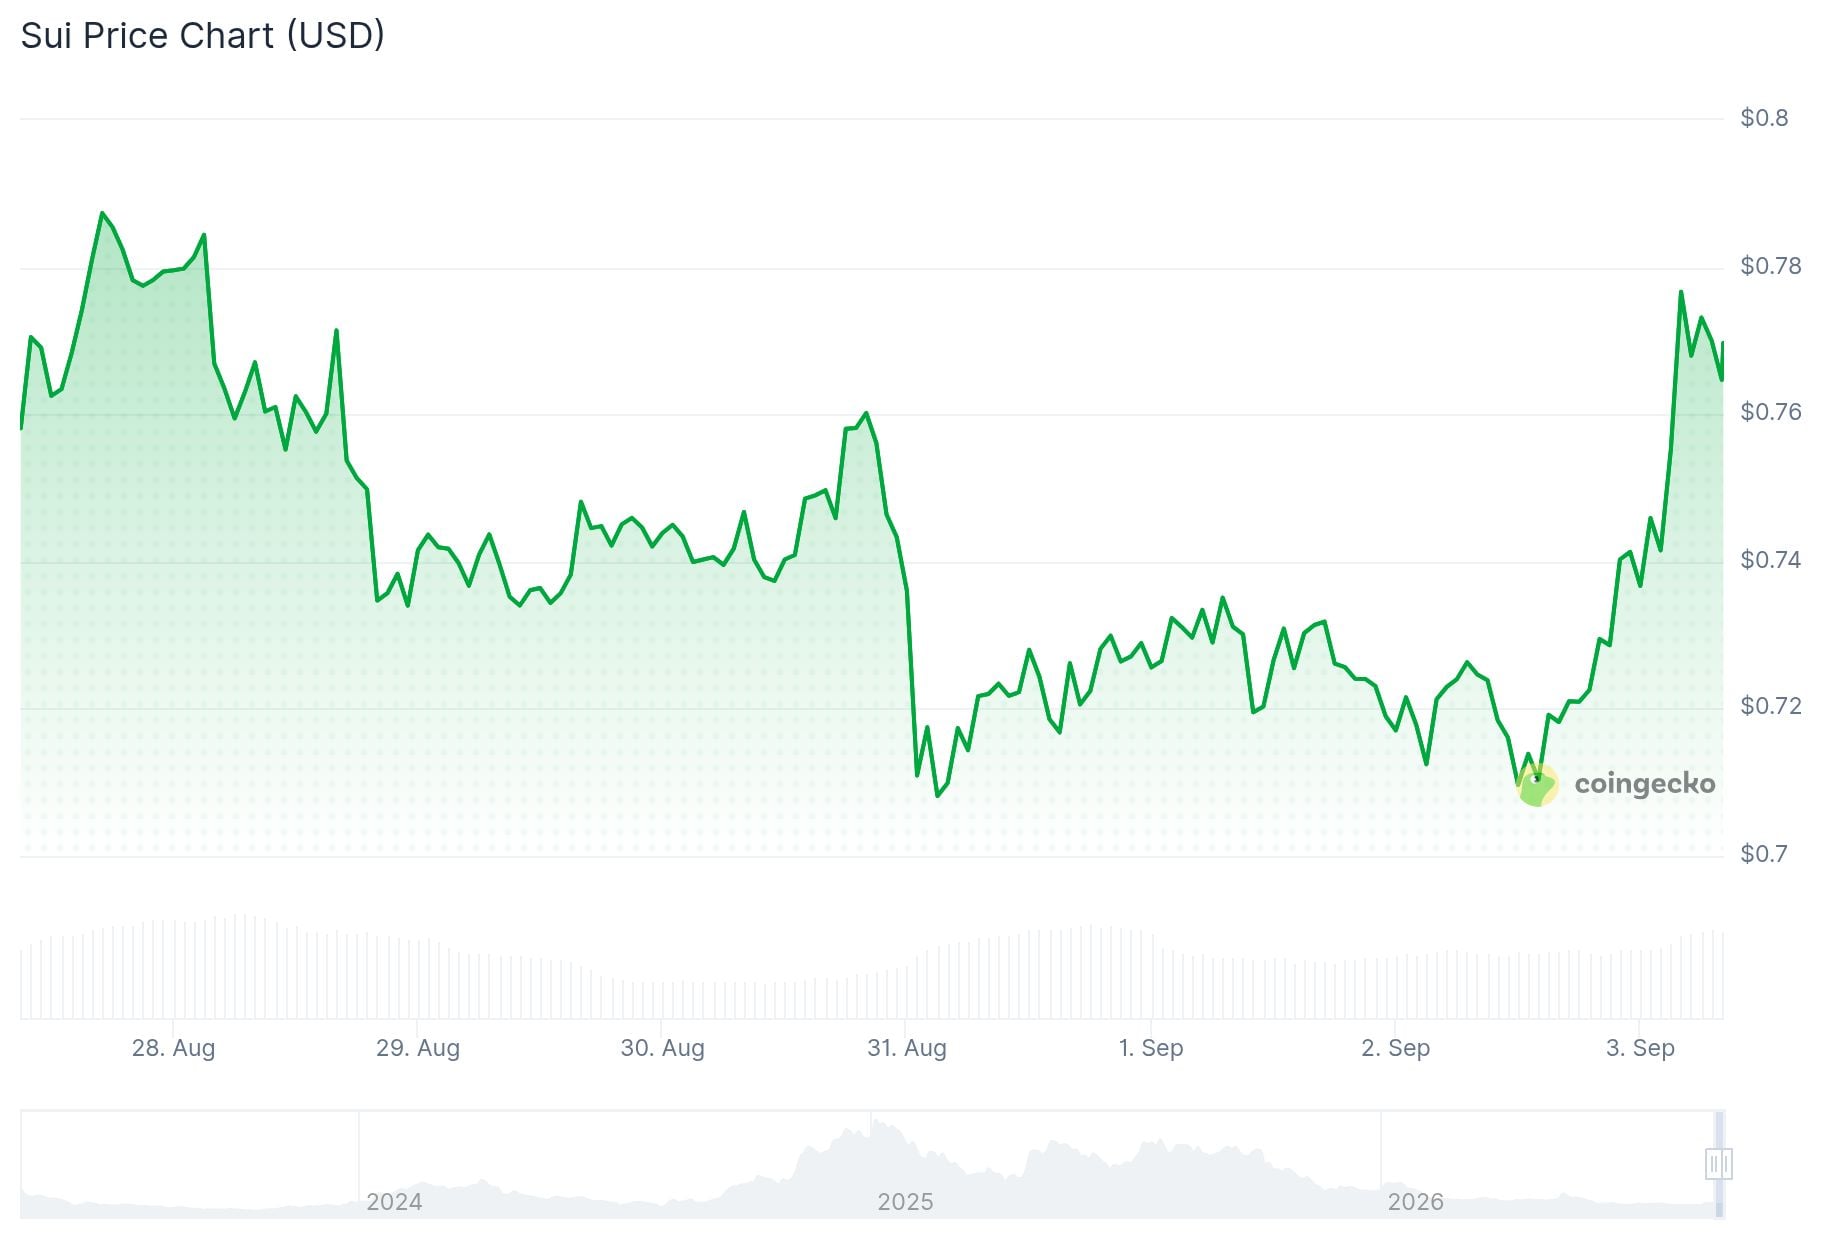
Futures volume over the past 24 hours came in at $607.97 million, with spot volume at $104.45 million and open interest at $581.34 million. Those numbers point to active trading around this price level even though SUI has been stuck below resistance for some time.
The key level to watch is $0.7641. A 4-hour close above that price on Binance would confirm a break of the descending trendline that has been capping the price for weeks.
If that break happens, the next resistance sits at $0.9564, followed by the round number $1.0000, which tends to attract extra attention from traders.
On the downside, a close below $0.6510 would put $0.5670 in play.
Liquidation Data Points to Long-Heavy Positioning
CoinGlass liquidation data from the past 24 hours shows longs took the majority of the pain. $525,940 in long positions were wiped out compared to just $75,160 in shorts, a lopsided ratio that shows leveraged buyers have already been punished trying to call a bottom early.
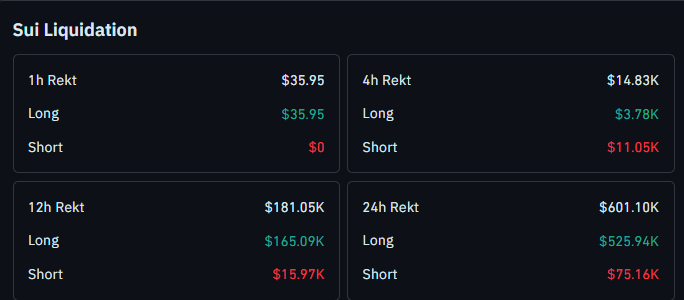
Over the past 4 hours, the picture shifted slightly, with $11,050 in short liquidations against just $3,780 in longs, hinting that some of the sellers near resistance are starting to get squeezed.

On Binance, top traders are sitting at a 72.5% long bias with a 2.63 long/short ratio. Retail traders are not far behind at 66.9% long. The taker buy/sell ratio stands at 1.22, suggesting active buying is hitting the market.
Yet despite that positioning, SUI has not been able to close above $0.74 with any conviction.
Technical Picture Remains Compressed
The MACD histogram on the daily chart has printed near zero, meaning momentum is flat. Buyers and sellers are essentially tied at this level.
The Stochastic reading of 13.59 puts SUI in deeply oversold territory, which is one signal that a snap bounce could come before further downside. Bollinger Band placement shows price drifting toward the lower half of the range, not the upper.
SUI: BUY THE DIP
The TD Sequential is flashing a buy signal on the $SUI daily chart, suggesting the recent correction could be nearing its end.
This indicator points to a potential 1–4 daily candlestick rebound or the beginning of a new bullish countdown.
I'm watching for the… https://t.co/JEHv6eCz2O pic.twitter.com/08riVJww4p
— Ali Charts (@alicharts) September 3, 2026
Analyst Ali Charts noted on social media that the TD Sequential indicator is flashing a buy signal on the SUI daily chart. He said the signal suggests the recent correction could be nearing its end and pointed to a potential 1–4 candle rebound or the start of a new bullish countdown.
Spot volume on Binance was $41.3 million in recent sessions, which analysts say is not enough fuel for a breakout without fresh catalysts.
The 200-day moving average sits at $0.85, a level that would need to be reclaimed for any structural trend reversal to be confirmed.


