






TLDR
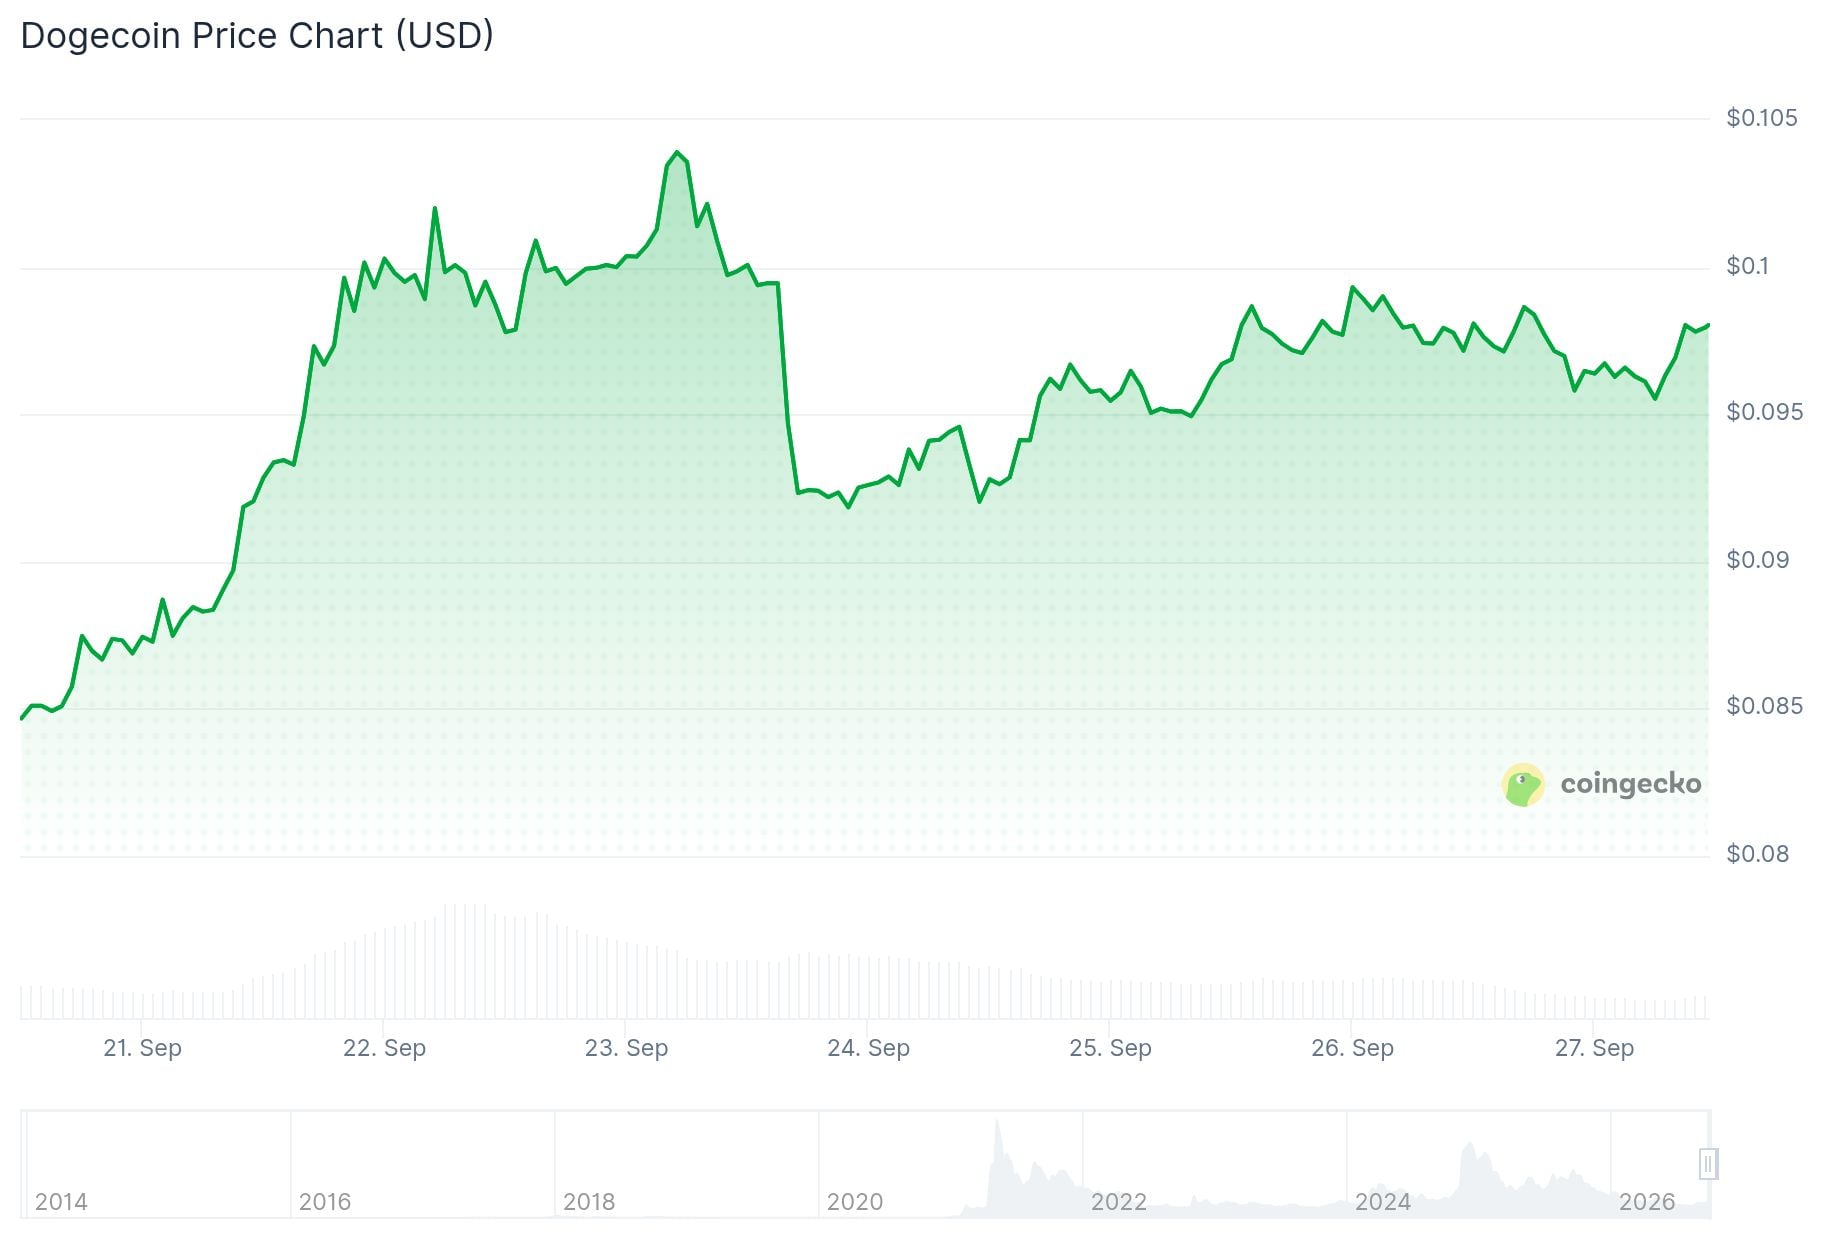
- Dogecoin trades near $0.0985 after another rebound from September lows.
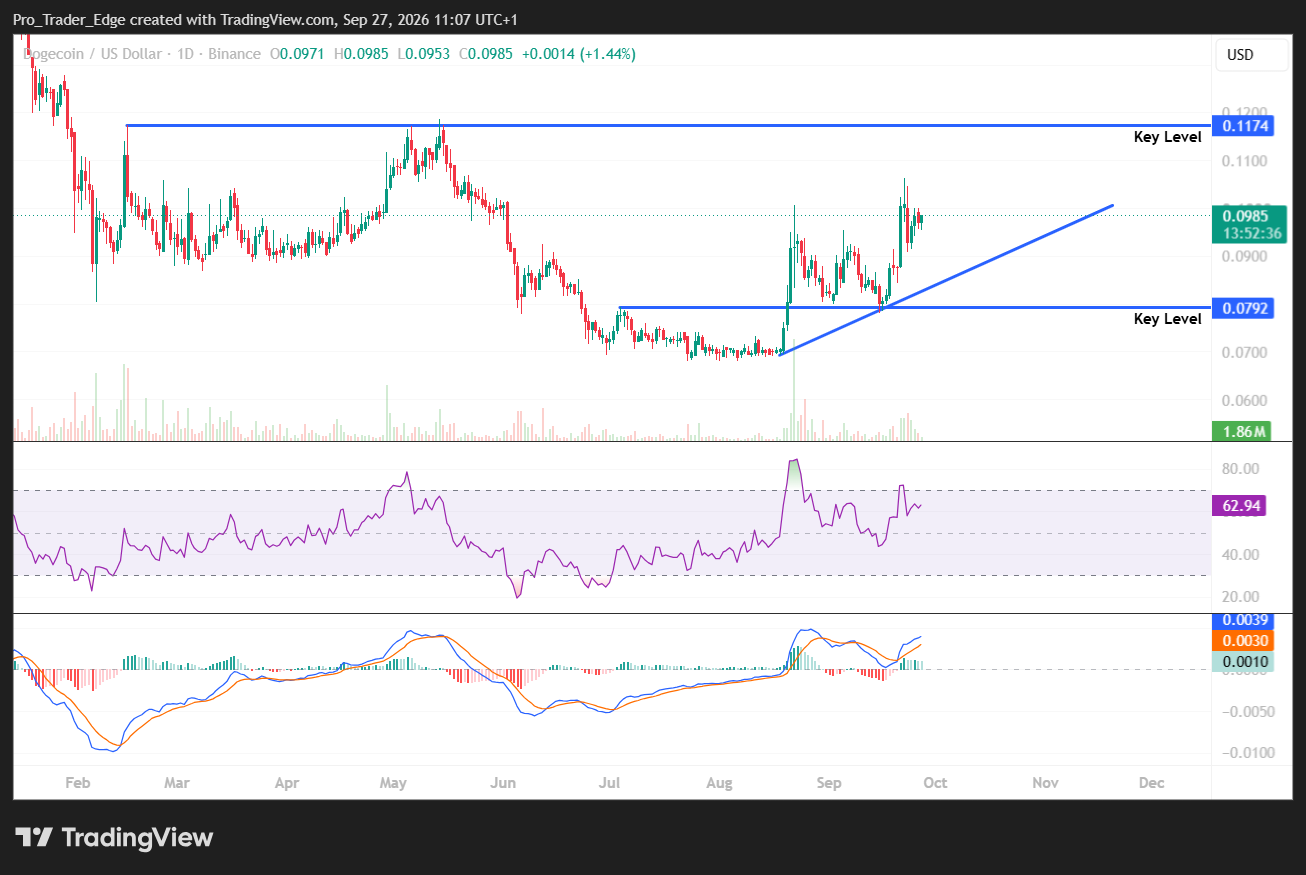
- A rising trend line from August keeps the short-term chart structure positive.
- Support sits near $0.0792, with major resistance marked at $0.1174.
- RSI reads 62.94, showing firm momentum without hitting overbought levels.
- MACD stays positive, with the line above its signal and histogram above zero.
Dogecoin is trading around $0.0985 after another push higher. The token remains above its rising daily trend line.
The latest daily candle opened near $0.0971 and touched a high close to $0.0985. DOGE was up about 1.4% at the time.
The broader picture has improved since August. Dogecoin bottomed near $0.069 before forming a pattern of higher lows and higher highs.
That move created a rising support trend line that has held through September. DOGE now trades above that line, which sits below the market near the low-$0.08 range.
Key Levels To Watch
The chart also shows a horizontal support zone around $0.0792. That level has acted as a pivot point during the recent recovery.
The next resistance sits at $0.1174. This level capped Dogecoin during the May rally and remains the strongest barrier on the daily chart.
DOGE is still some distance from that mark, but the recent rebound has brought it back into view.

Before testing $0.1174, buyers need to hold the $0.10 area. DOGE has approached that psychological level several times this month.
A move above $0.10 would strengthen the short-term setup and open a clearer path toward the May resistance zone.
If price pulls back, the rising trend line offers first support. The $0.0792 level remains the more important floor.
A break below $0.0792 would weaken the current higher-low pattern and put the August base back in focus.
Momentum And Whale Activity
Dogecoin’s Relative Strength Index sits at 62.94. That is above the neutral 50 mark but below the 70 overbought threshold.
This points to firm buying momentum that has not stretched too far. MACD is also positive, with the MACD line near 0.0039 against a signal line near 0.0030.
The histogram reads roughly 0.0010, showing short-term momentum has picked up again after the recent pullback. Volume has risen during several September sessions, including the breakout from $0.0792.
$112 MILLION IN DOGE BOUGHT BY WHALES
Dogecoin has hit a major resistance zone around $0.098, where roughly 28 billion DOGE previously traded.
Yet whales continue to accumulate.
Over the past 96 hours, large entities have bought more than 1.14 billion $DOGE, worth roughly $112… https://t.co/iOZjrpYABR pic.twitter.com/cfPrkShuk1
— Ali Charts (@alicharts) September 27, 2026
Analyst Ali Charts pointed to whale buying during this stretch. He wrote that Dogecoin has hit resistance around $0.098, a zone where roughly 28 billion DOGE previously changed hands, yet whales have bought over 1.14 billion $DOGE in the past 96 hours, worth close to $112 million, positioning for a breakout.
The chart shows DOGE holding above trend support with momentum indicators still pointing higher. The market is now working to build enough strength to challenge $0.10 and, beyond that, the $0.1174 resistance zone.


