





Stablecoins are digital tokens built to hold a steady price, most often one US dollar. They started as a tool for crypto traders. In 2026 they also move money for businesses, banks and payment firms.
This article collects the main numbers on the market. Figures are as of 13 August 2026 unless noted. Where sources disagree, both figures are shown.
| Measure | Figure |
|---|---|
| Total market cap | $308.0 billion |
| Change over 12 months | +$38.59 billion (+14.3%) |
| Change over 30 days | -$3.23 billion (-1.04%) |
| All-time peak | $322.4 billion on 17 May 2026 |
| Largest stablecoin | USDT, 59.1% of supply |
| Largest chain | Ethereum, 48.7% of supply |
| Share in US dollars | About 99.5% |
Source: DefiLlama aggregate stablecoin supply, 13 August 2026.
1. Market size and growth
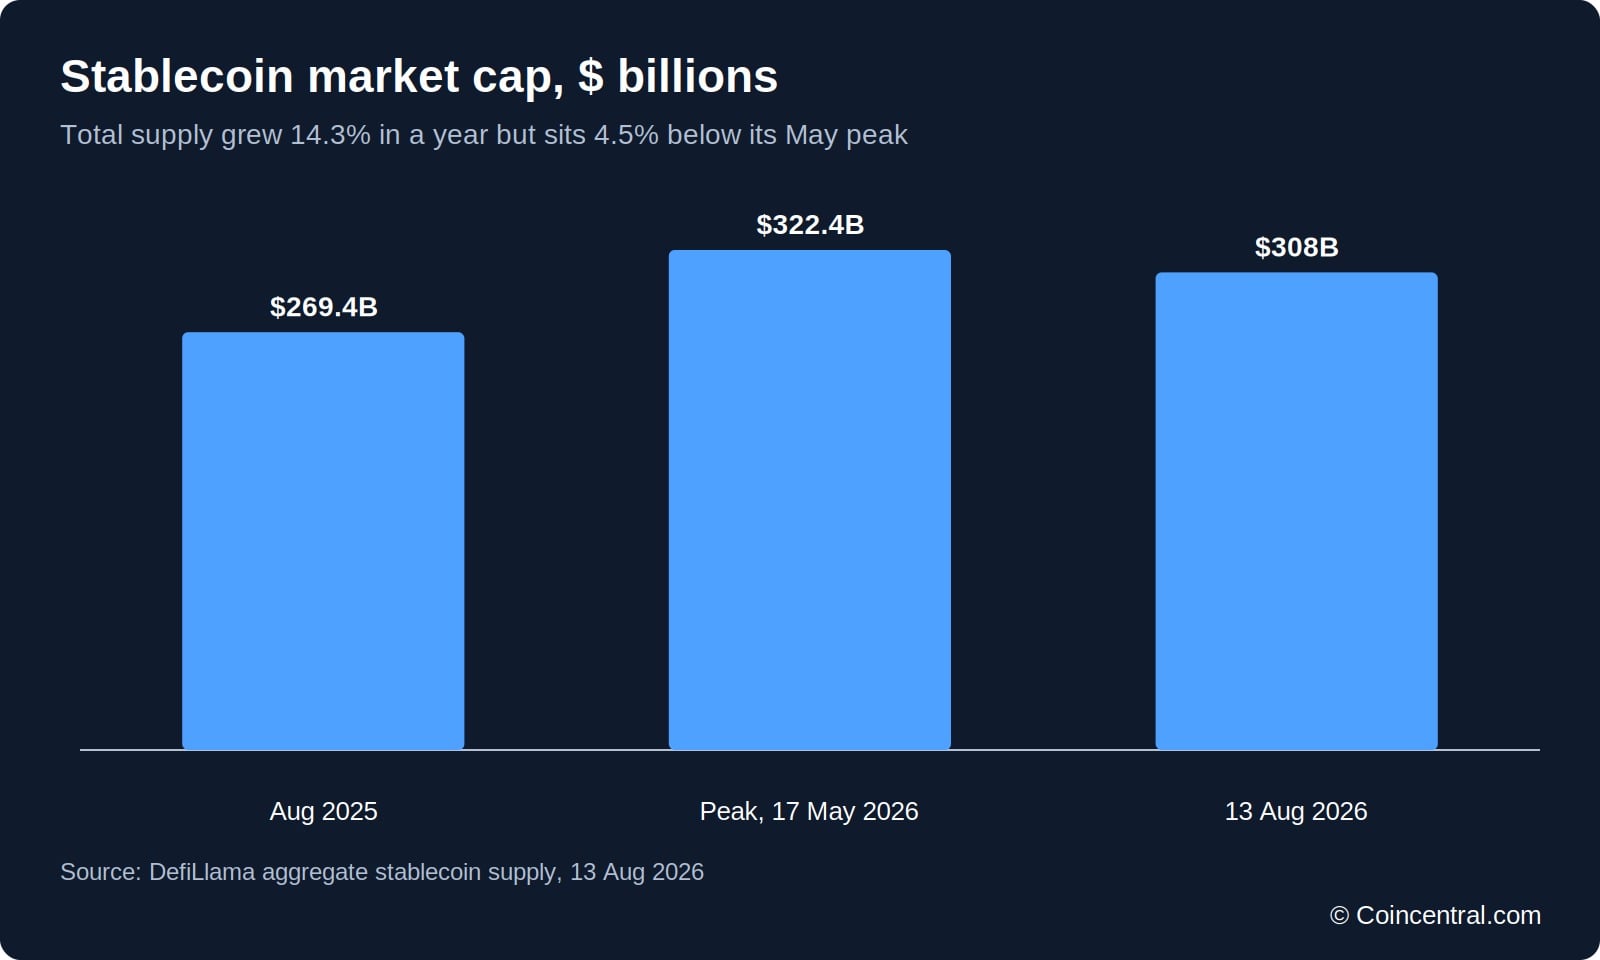
Total stablecoin supply stood at $308.0 billion on 13 August 2026, according to DefiLlama. A year earlier it was $269.4 billion. That is growth of 14.3% over twelve months.
Supply peaked at $322.4 billion on 17 May 2026. It now sits 4.5% below that high and is flat for the year to date. The pullback came mostly in June and July.
Other sources give slightly different totals because of timing and what they count. One report put the market at $312 billion in October 2025. Statista listed $292.75 billion for July 2026.
Stablecoins make up about 13% of the crypto market by value in one source and roughly 10% in Statista’s figures. About 269 million on-chain addresses hold a stablecoin balance, according to rwa.xyz.

Stablecoin supply has moved apart from crypto prices. It fell more than 30% in the last bear market, but it has held near record levels in the 2026 downturn.
| Period | Change in supply |
|---|---|
| 30 days | -$3.23 billion (-1.04%) |
| 90 days | -$13.79 billion (-4.28%) |
| Year to date | Flat |
| 12 months | +$38.59 billion (+14.3%) |
2. Tether and USDC lead the market
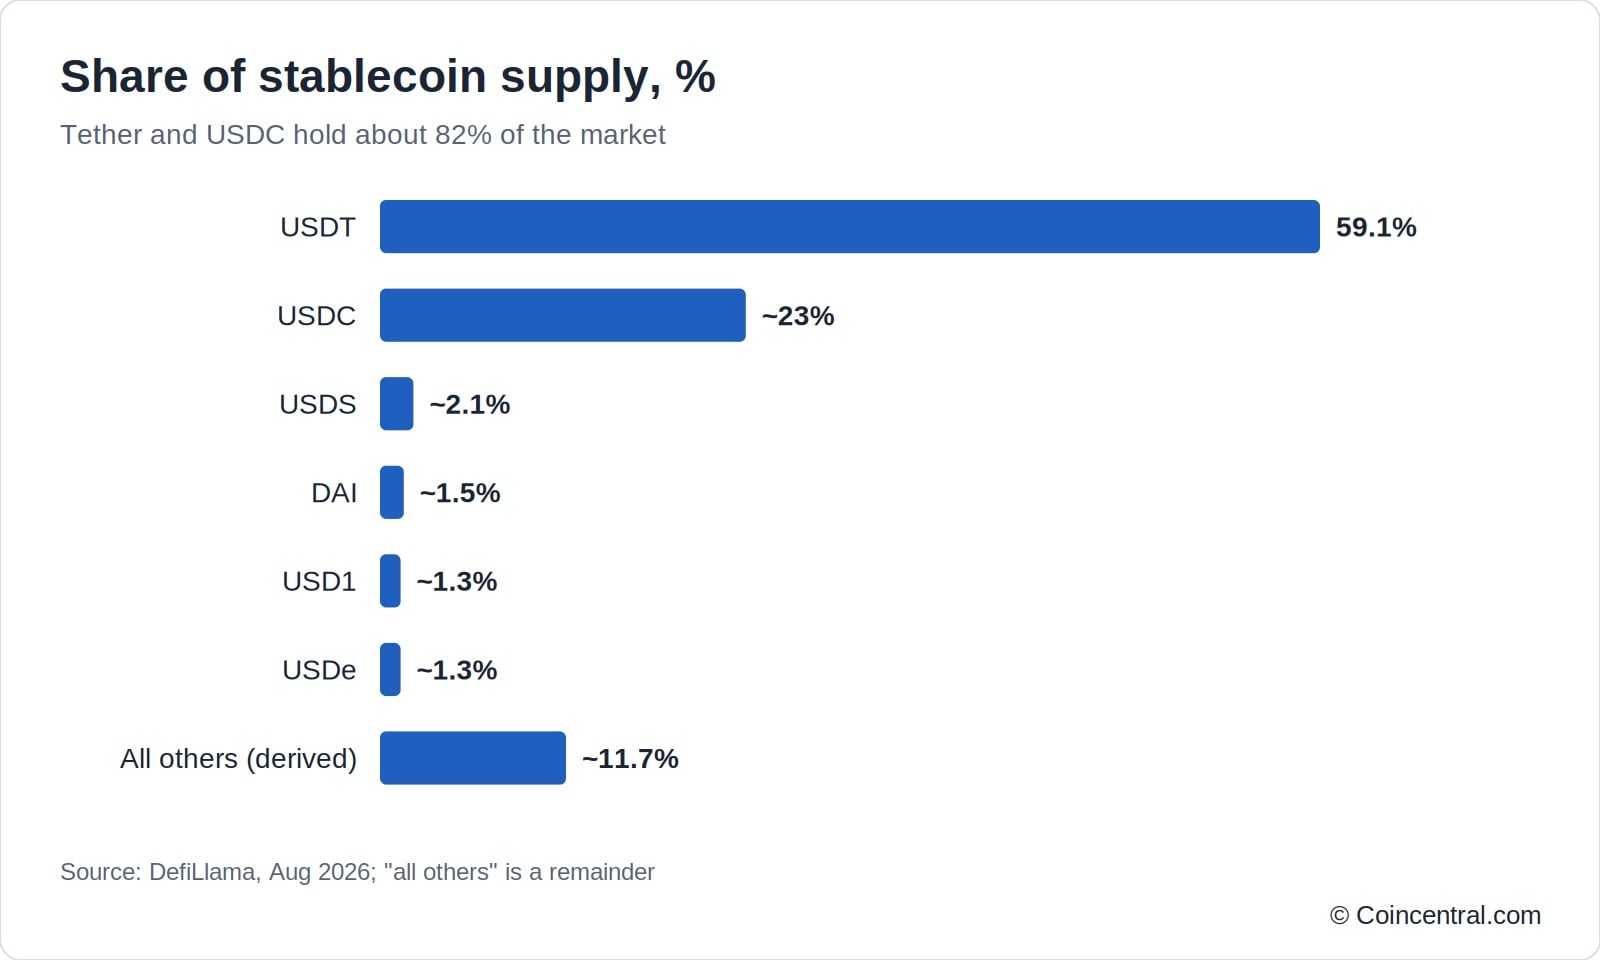
Tether’s USDT holds about 59% of stablecoin supply. USD Coin (USDC) is second at about 23%. Together they hold roughly 82% of the market, according to DefiLlama.
The picture changes when volume is the measure. USDT makes up about 74% of stablecoin trading volume on centralised exchanges. But USDC led on adjusted transaction volume in 2025, at $18.3 trillion against $13.3 trillion for USDT, per Artemis data reported by Bloomberg.
Statista counts 213 stablecoins worldwide. Only two have passed $10 billion in market value. The rest of the field is small.
| Stablecoin | Share of supply |
|---|---|
| USDT (Tether) | 59.1% |
| USDC (Circle) | ~23% |
| USDS (Sky Dollar) | ~2.1% |
| DAI | ~1.5% |
| USD1 (World Liberty Financial) | ~1.3% |
| USDe (Ethena) | ~1.3% |
| USDG (Global Dollar) | ~1.1% |
| USYC (Circle) | ~1.0% |
| PYUSD (PayPal) | ~0.9% |
| RLUSD (Ripple) | ~0.5% |
The US dollar dominates. About 99.5% of supply is dollar-denominated, and the BIS puts the figure at 99.4%.
Non-dollar stablecoins reached a record of only about $2 billion, up roughly 42% in 2026. Euro stablecoins total about 450 million to 500 million euros. Issuers include Circle (EURC), Societe Generale Forge (EURCV) and Banking Circle (EURI), all authorised under the EU’s MiCA rules, according to the ECB.
3. Which blockchains and regions carry stablecoins
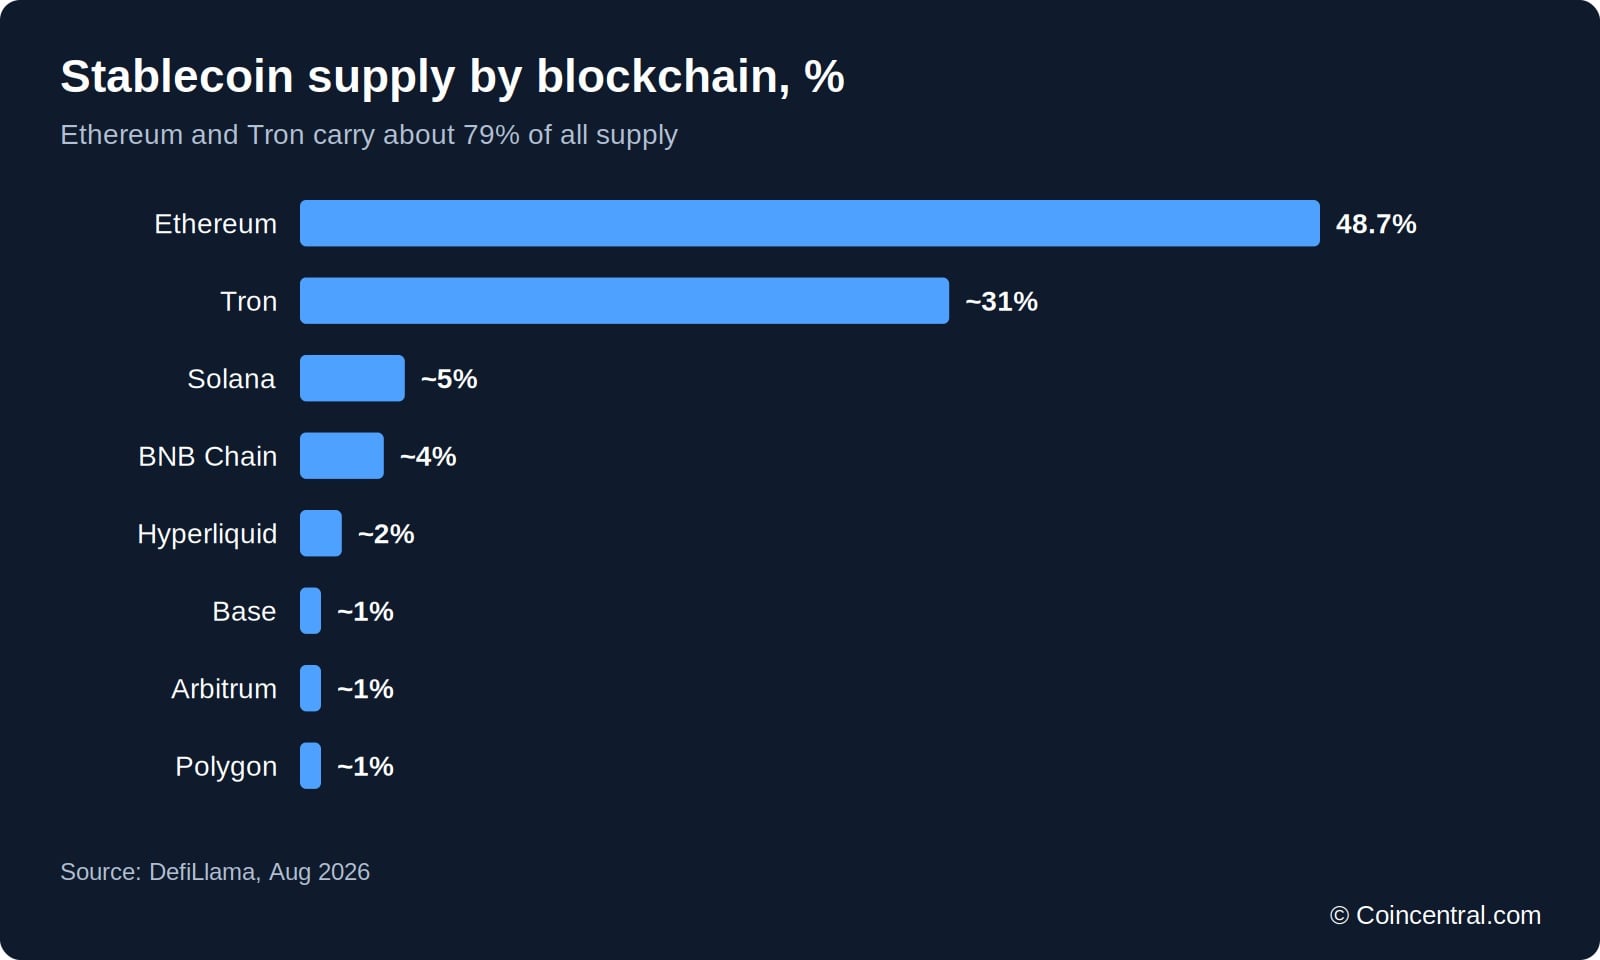
Ethereum carries the most stablecoin supply at about 49%. Tron is second at about 31%. Together they hold roughly 79% of all supply.
Solana has about 5% and BNB Chain about 4%. Hyperliquid holds about 2%. Base, Arbitrum and Polygon hold about 1% each.
Payments tell a different story. Tron carries 60% to 80% of real-economy flows. Its share fell from about 74% in January 2025 to about 60% at the end of the year, as regulated volume moved to Ethereum, Solana, BNB Chain and Polygon.
Asia is the largest region for stablecoin flows, at $12.5 trillion in 2025, up 67% from a year earlier, according to CoinDesk. Latin America is the fastest-growing region for real-world use, driven by inflation protection and remittances. Most stablecoin flows happen outside the United States.
In South Asia, stablecoin-driven crypto volumes rose 80% to $300 billion between January and July 2025, according to a report from Hinkal citing industry data.
Statista shows 60.72 million monthly active addresses, up 5.98% in 30 days, and 295.65 million holders, up 2.75%. Its monthly transfer volume was $6.28 trillion, down 25.19% over the same period.
Wallet counts vary by method. Rwa.xyz counts about 269 million addresses holding a balance. Hinkal cites more than 500 million unique wallet addresses by Q3 2025, up from 350 million in 2023.
4. Transaction volume: how much is real payments?
Raw on-chain volume looks huge. Estimates of gross stablecoin transfers in 2025 range from about $28 trillion (BIS) to $33 trillion (Artemis) to more than $62 trillion (BCG and Allium). The gap comes from different rules about what to count.
Most of that volume is not spending. It is trading, bot activity and funds moving between wallets and exchanges. BCG estimates only about 7% of transfers, or $4.2 trillion, was genuine economic activity.
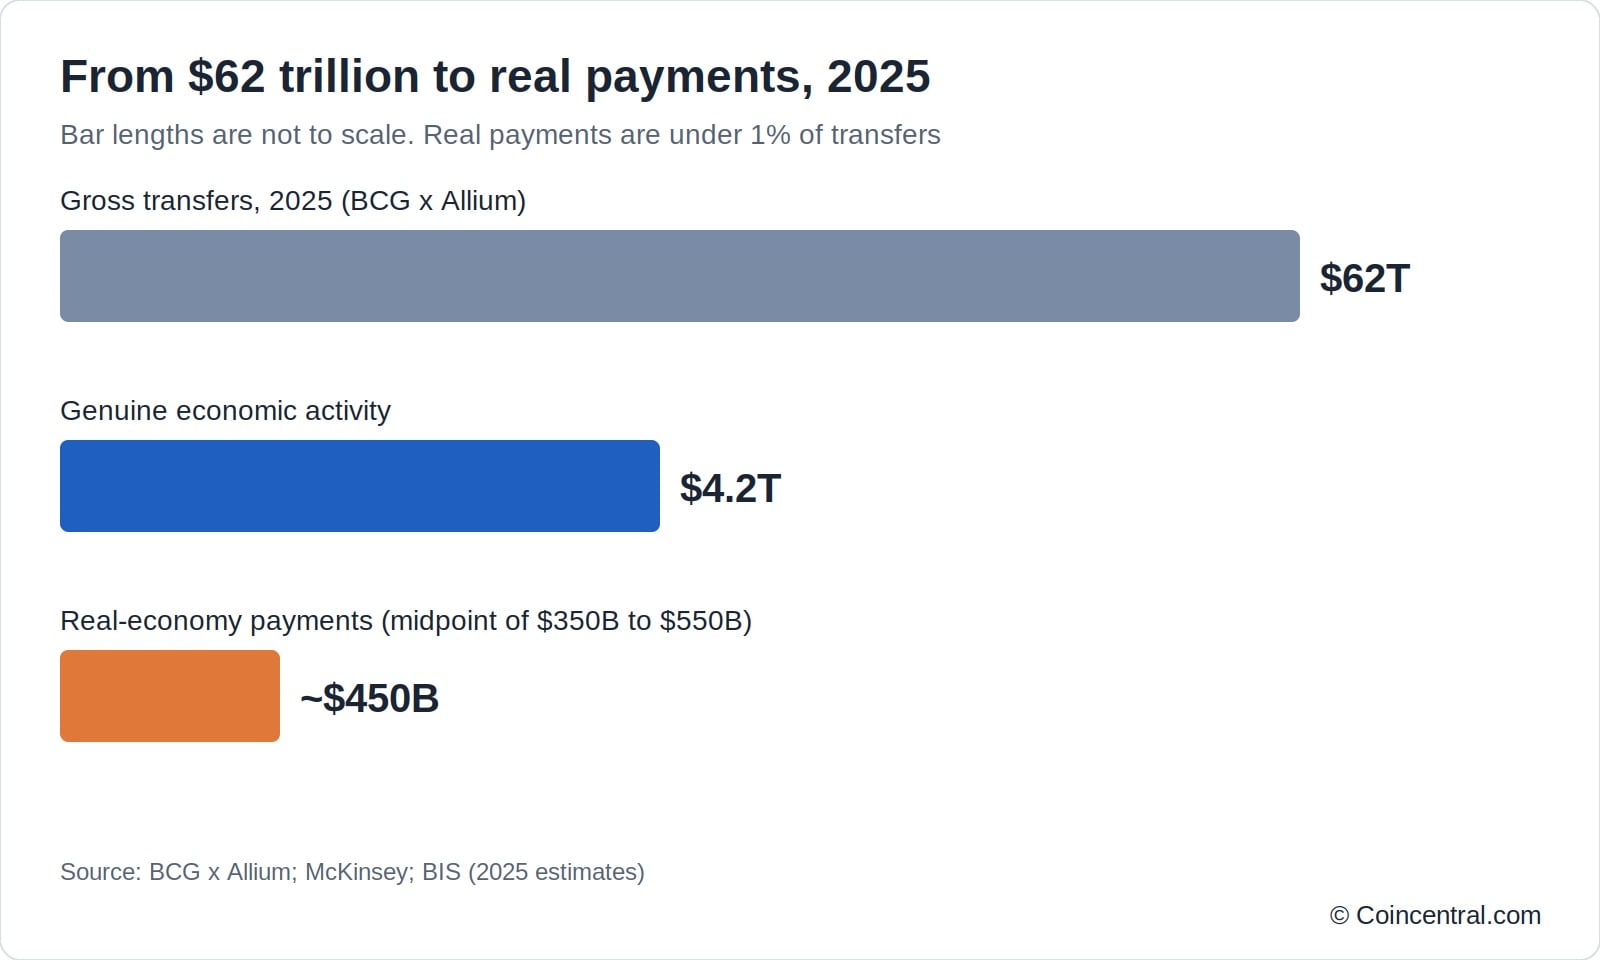
Real payments for goods and services were far smaller. BCG puts them at $350 billion to $550 billion in 2025, up about 60% from the year before. McKinsey and Artemis estimate about $390 billion. That is under 1% of total transfer volume.
Statista reports annualised stablecoin payment volume of $390 billion at the end of 2025. Of that, business-to-business payments were $226 billion, or 58%.
| Source | 2025 estimate | What it measures |
|---|---|---|
| BIS | ~$28 trillion | Gross transfers |
| Artemis | ~$33 trillion | Gross transfers |
| BCG x Allium | $62 trillion+ | Gross transfers |
| BCG x Allium | $4.2 trillion | Genuine economic activity |
| BCG | $350 to $550 billion | Real-economy payments |
| McKinsey / Artemis | ~$390 billion | Real-economy payments |
Some monthly totals are still large. Stablecoins settled $7.2 trillion in February 2026, passing the US ACH network at $6.8 trillion for the first time. March reached $7.5 trillion.
Estimates differ because blockchains record how value moves, not why. Researchers have to infer the purpose of each transfer.
5. Net inflows and outflows
Net flows measure new tokens minted minus tokens redeemed. Rising supply means money is entering the stablecoin system. Falling supply means it is leaving.
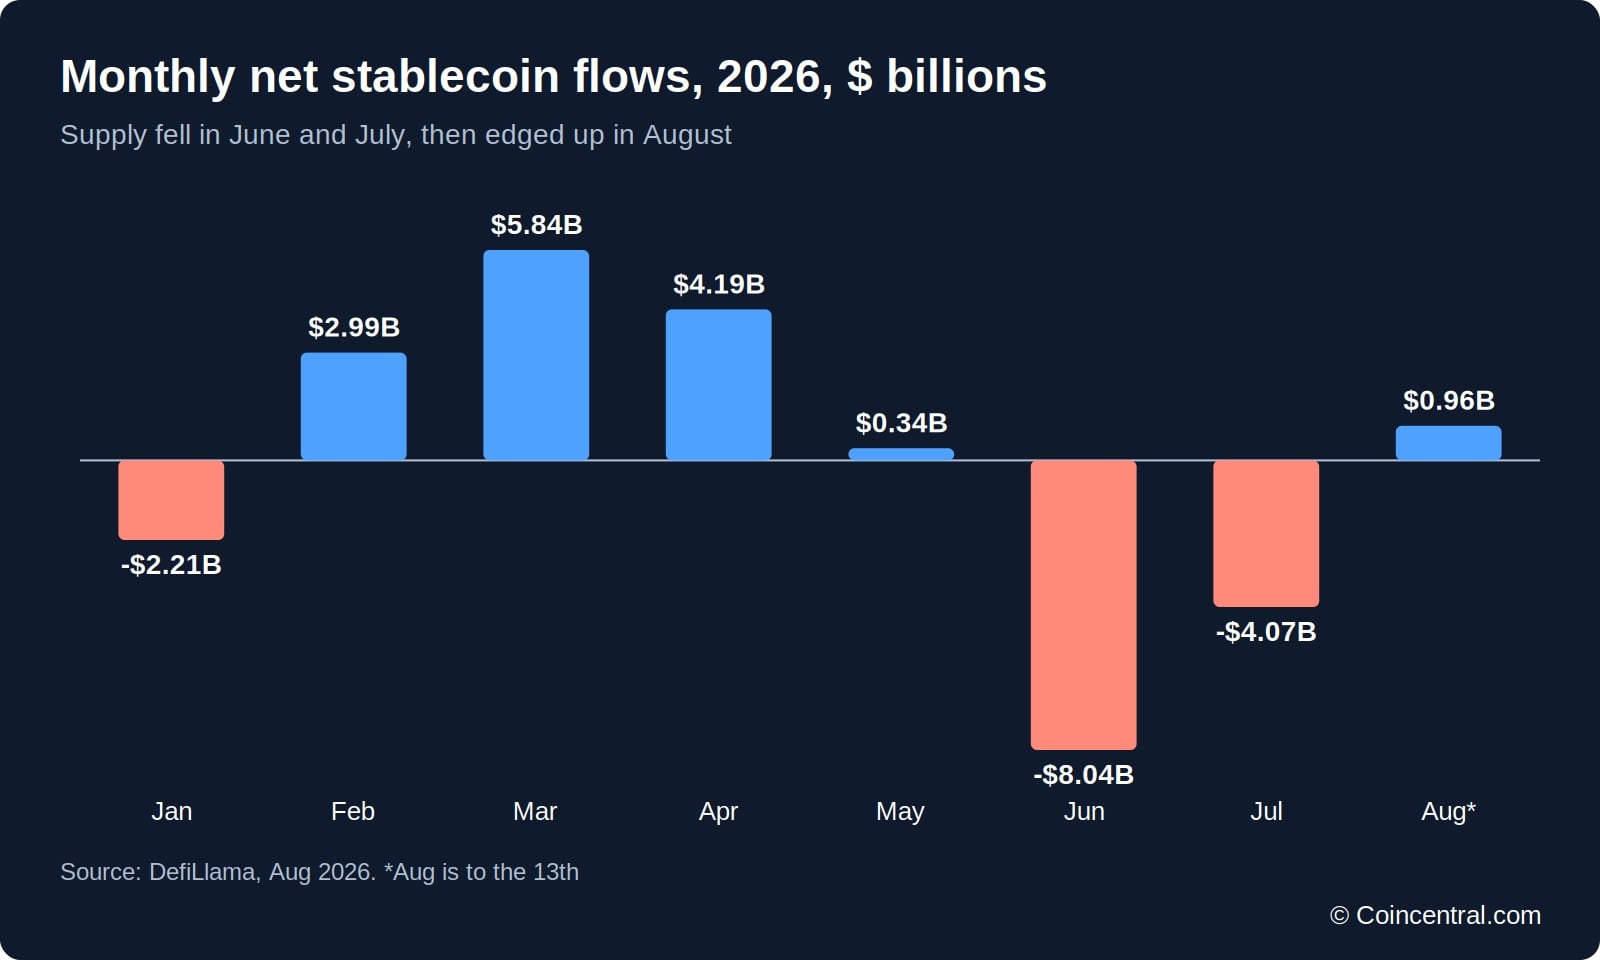
Supply shrank in June and July 2026, then steadied in August. June was the weakest month, with an outflow of $8.04 billion. The monthly figures net out to roughly zero for the year so far.
| Month, 2026 | Net flow |
|---|---|
| January | -$2.21 billion |
| February | +$2.99 billion |
| March | +$5.84 billion |
| April | +$4.19 billion |
| May | +$0.34 billion |
| June | -$8.04 billion |
| July | -$4.07 billion |
| August (to the 13th) | +$0.96 billion |
The total hides differences between issuers. Over the 30 days to 13 August, Global Dollar (USDG) grew fastest among the ten largest at 17.2%. World Liberty Financial USD (USD1) fell the most, by 9.0%. USDT lost 0.7% and USDC lost 1.2%.
Traders also watch the Stablecoin Supply Ratio (SSR). It compares Bitcoin’s market value with stablecoin supply. A lower number means more stablecoin buying power relative to Bitcoin.
SSR was about 4.16 on 13 August 2026. This was calculated from a Bitcoin market value of about $1,281.7 billion (CoinGecko) and stablecoin supply of $308.0 billion. It is a derived figure, not one taken from a single source.
6. Payments, cards and business adoption
Spending on stablecoin-linked cards reached about $18 billion on an annualised basis in late 2025 and early 2026. That is close to peer-to-peer transfers at about $19 billion. Card spending has grown about 106% a year since January 2023.
Other sources use different definitions. Statista reports $4.5 billion in stablecoin-linked card spending for 2025, up 673% from $582 million in 2024. Visa has reported annualised stablecoin figures of $3.5 billion in late 2025 and $4.5 billion in settlement volume in January 2026.
Business-to-business payments grew from under $100 million a month in early 2023 to over $6 billion a month by mid-2025. Consumer-to-business payments grew 131% in 2025. The average stablecoin peer-to-peer transfer was $47, compared with $250 for a traditional remittance.
Cost and speed drive much of the interest. Sending money across borders still costs 6.49% on average (World Bank, Q1 2025), well above the G20 target of 3%. Stablecoin transfers run about 40% cheaper once total costs are counted, according to BVNK.
Only 35% of retail cross-border payments reach the recipient within an hour, against a G20 target of 75%. Stablecoin transfers usually settle in minutes or seconds.
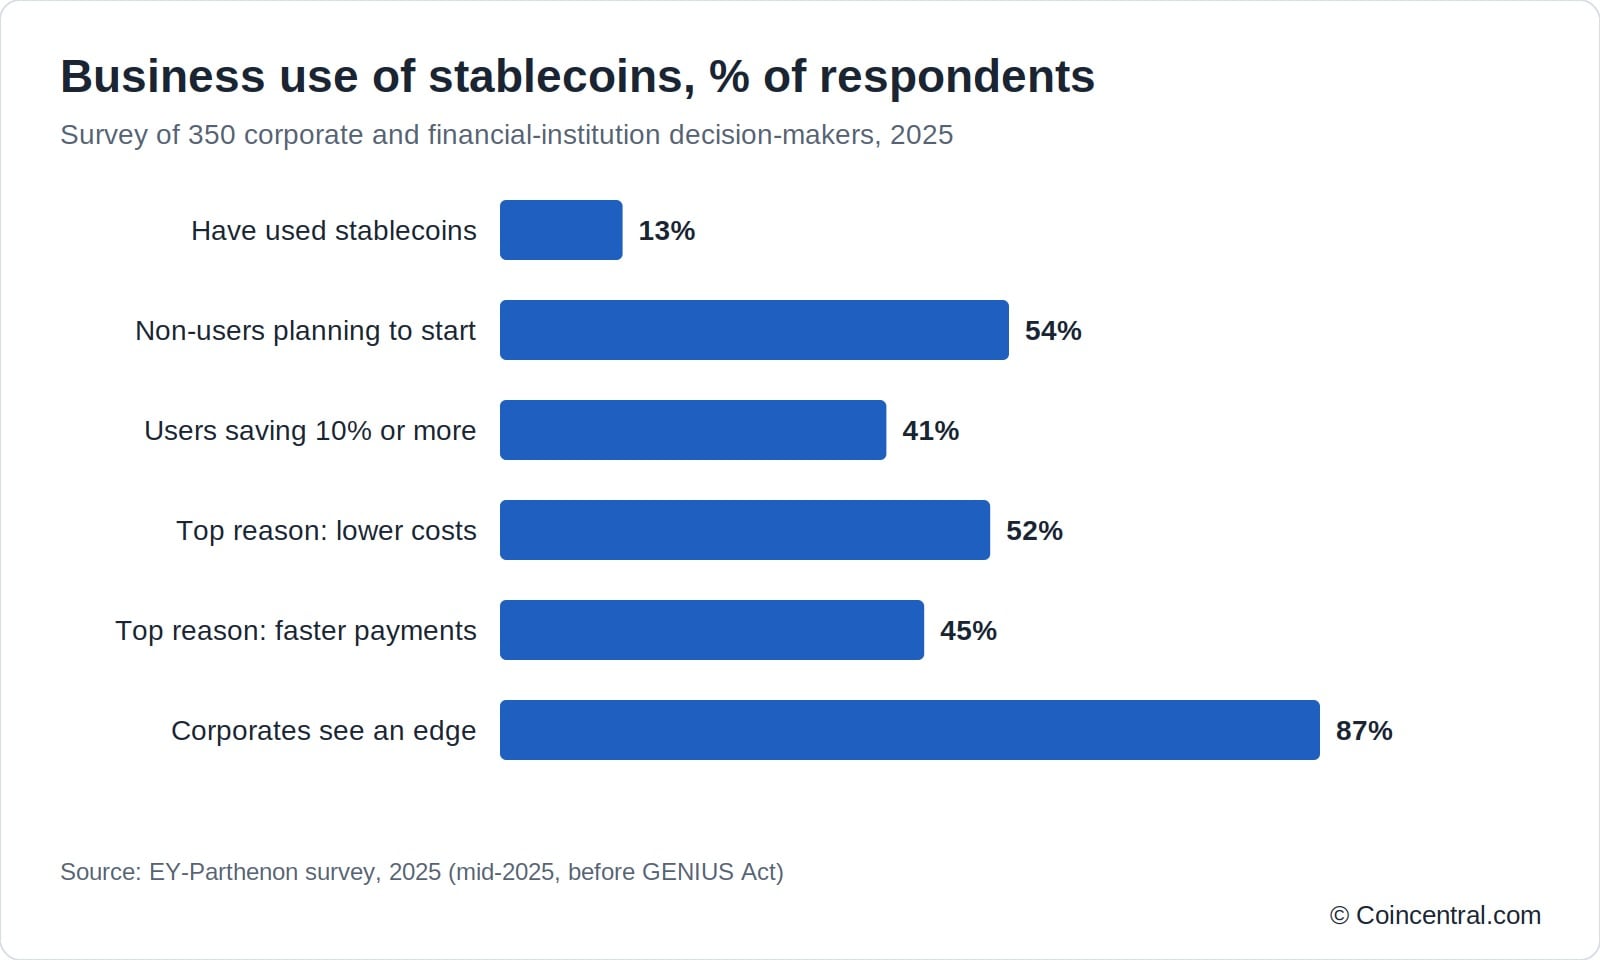
An EY-Parthenon survey of 350 corporate and financial-institution leaders gives a view of business use. It was run in mid-2025, before the GENIUS Act was signed, so it is a snapshot and not live market share.
| Survey finding (EY-Parthenon, 2025) | Result |
|---|---|
| Organisations that have used stablecoins | ~13% (23% of financial institutions, 8% of corporates) |
| Non-users expecting to start within 6 to 12 months | 54% |
| Users reporting cost savings of 10% or more | 41% |
| Top reason: lower transaction costs | 52% |
| Top reason: faster cross-border payments | 45% |
| Top use: paying suppliers across borders | 62% |
| Top use: accepting cross-border payments | 53% |
| Corporates who see a competitive advantage | 87% |
7. Reserves and stability
What backs a stablecoin differs by issuer. Tether reported about $141 billion in direct and indirect US Treasury bill exposure at 31 March 2026. It says this makes it the 17th largest holder of US Treasuries.
Circle holds about one-third of USDC reserves in Treasuries, with the rest in overnight repo and cash. Gemini’s GUSD is backed fully by bank deposits.
| Issuer | Reserve backing | Source |
|---|---|---|
| Tether (USDT) | ~$141B in T-bill exposure, 31 Mar 2026 | Q1 2026 attestation, BDO |
| Circle (USDC) | About one-third Treasuries, rest overnight repo and cash | Circle |
| Gemini (GUSD) | 100% bank deposits | May 2026 attestation |
Circle holds USDC reserves in the Circle Reserve Fund. It is an SEC-registered money market fund managed by BlackRock, with BNY Mellon as custodian. Deloitte & Touche is Circle’s independent auditor.
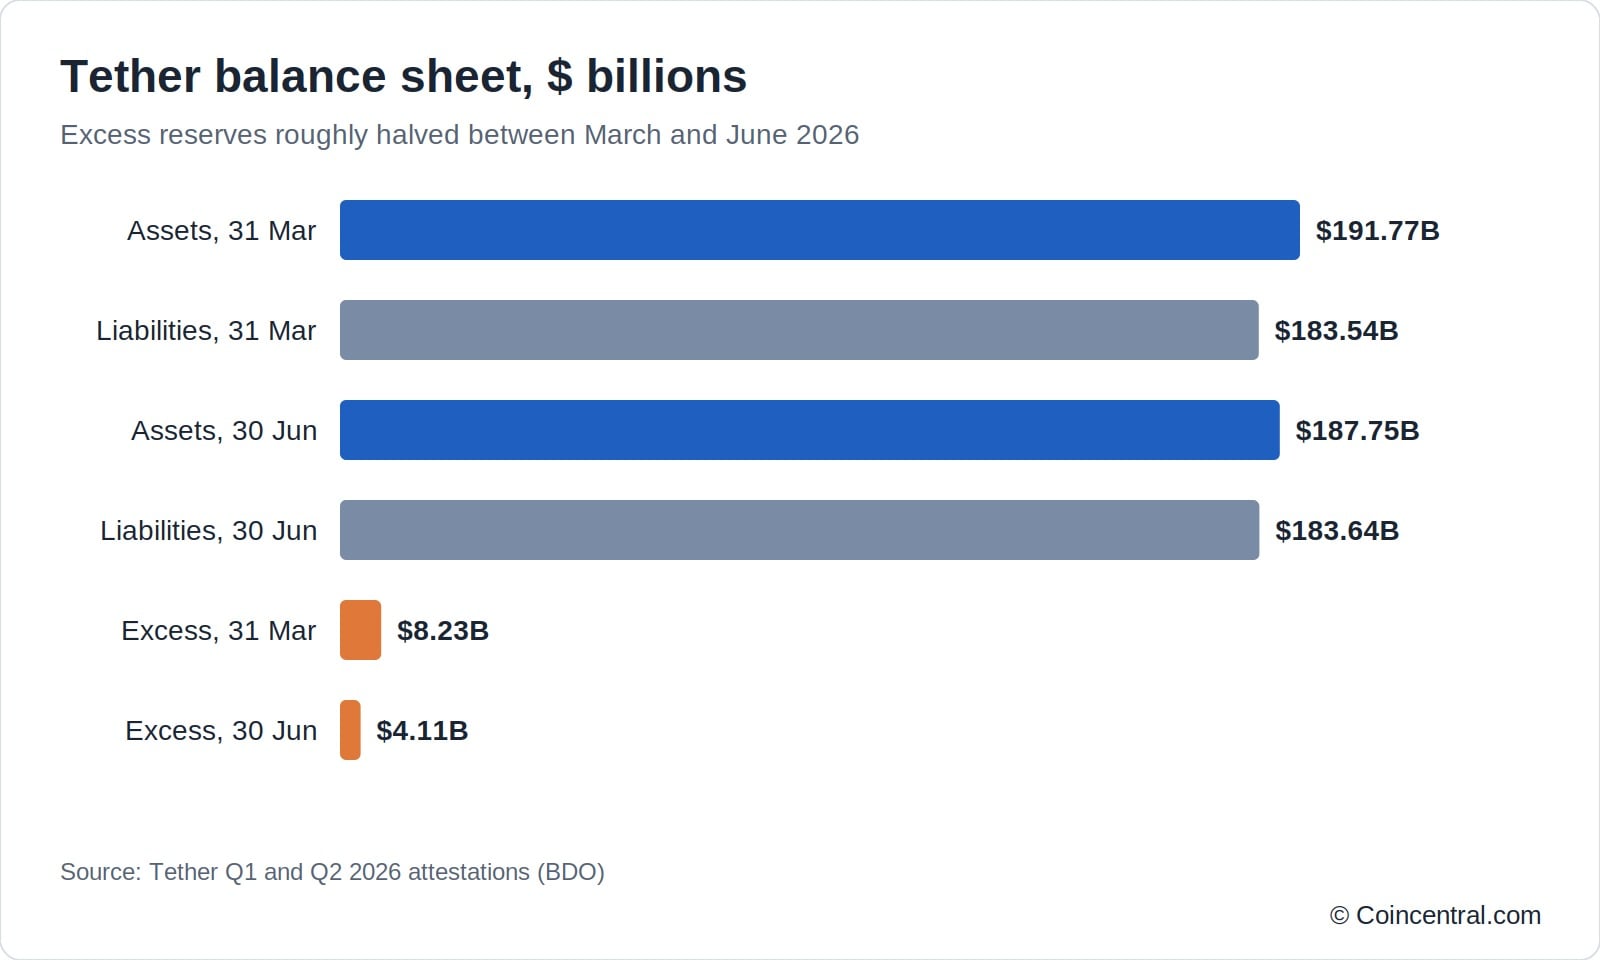
Tether’s cushion has shrunk. At 31 March 2026 it had $191.77 billion in assets against $183.54 billion in liabilities, leaving $8.23 billion in excess reserves. By 30 June, assets were $187.75 billion against $183.64 billion, leaving $4.11 billion.
Issuers as a group now rank among the top 20 foreign holders of short-term US Treasuries. Hinkal reports that Tether and Circle together held $177.6 billion in Treasury exposure at the end of Q2 2025. Tokenized Treasury funds add more: Circle USYC holds about $3.0 billion and BlackRock BUIDL about $2.7 billion.
Stability is not guaranteed. In March 2026, the stablecoin ResolvUSD (USR) was exploited for about $80 million. It fell as low as $0.14, and its market value dropped 55.9% to about $49 million.
Regulators note that stablecoins often act more like exchange-traded fund shares than cash. They can drift from par, and redemption can be slow.
8. Regulation and the market reaction
Investors treated the US GENIUS Act as a real threat to payment firms. An IMF study found the law cut the value of listed incumbent payment firms by about 18%, or roughly $300 billion.
Cross-border payment firms fell the most, by about 27%. Card networks and crypto-focused firms were largely shielded.
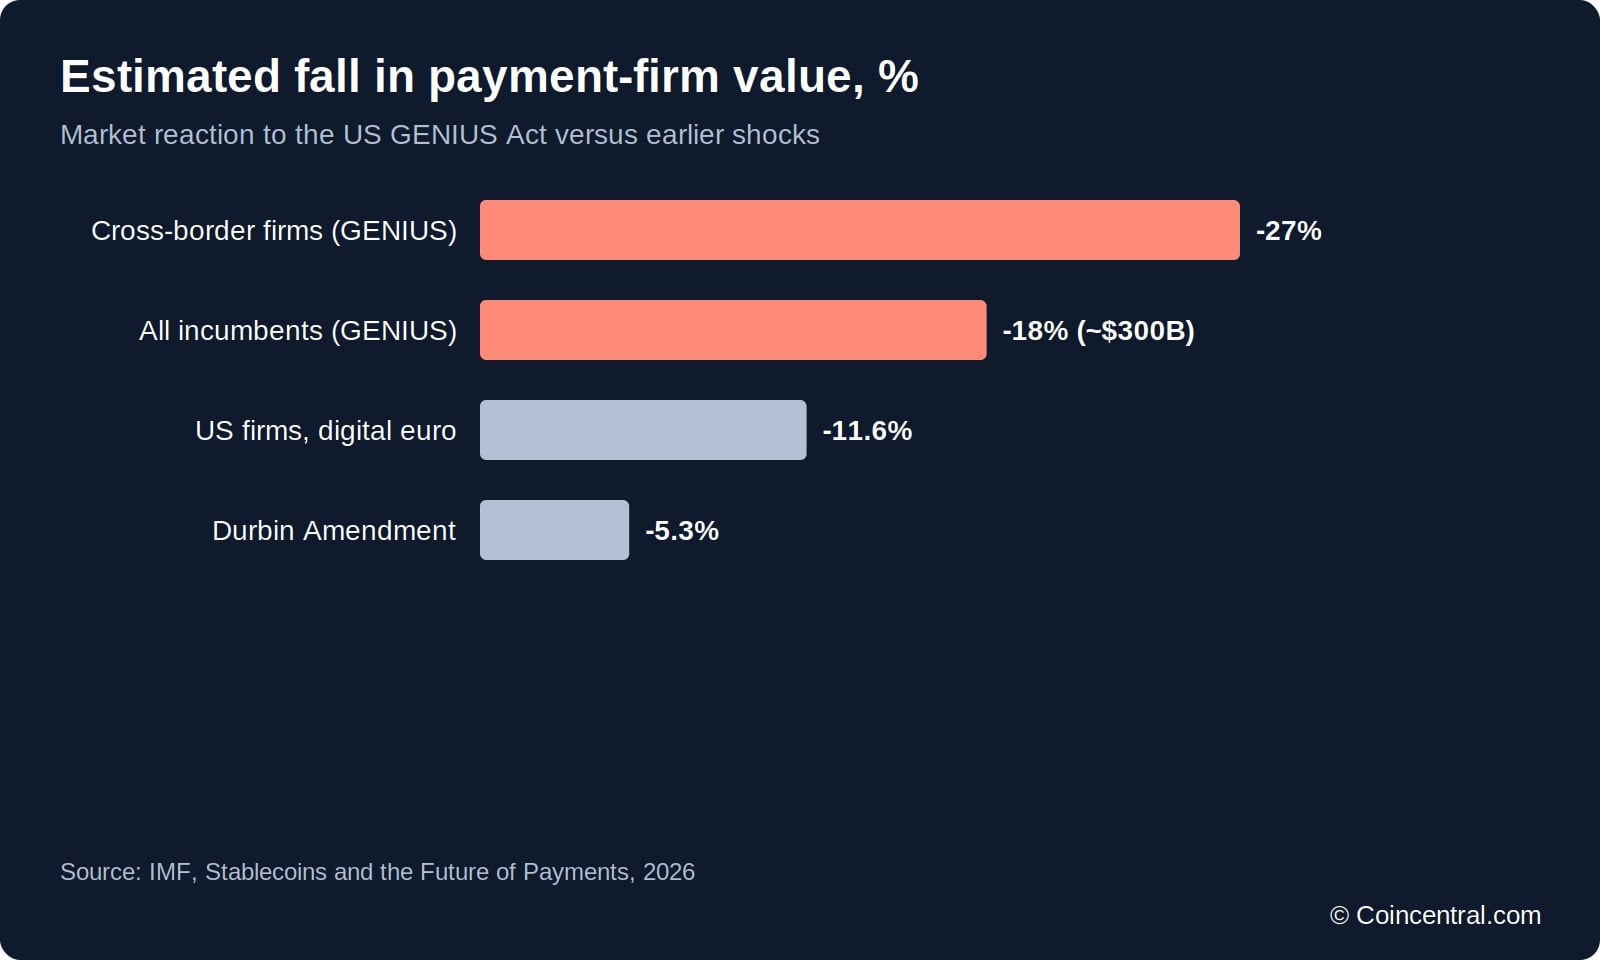
The hit was larger than earlier rule changes. The Durbin Amendment cut firm values by 5.3%. An expected digital euro was linked to an 11.6% drop for US firms.
For scale, the 35 listed US payment firms in the study were worth about $1.5 trillion in 2024. That is about 77% of the market value of all listed US commercial banks.
| Region | Law | Key dates |
|---|---|---|
| United States | GENIUS Act | Signed 18 July 2025; full regime expected by January 2027 |
| European Union | MiCA | Stablecoin rules since 30 June 2024; legacy transition ended 1 July 2026 |
| Hong Kong | Stablecoins Ordinance | Effective 1 August 2025; first two licences granted 10 April 2026 |
Other markets are moving too. Singapore’s framework is live with 6 to 8 issuers. Japan passed rules first, and JPYC launched in October 2025. South Korea has a framework but no dedicated stablecoin law, and China keeps a full private ban.
Major regimes share three themes: full reserve backing, redemption at par and a ban on paying interest to holders. In the US, reserves must be held one-to-one in cash and short-term Treasuries, with monthly audited disclosures.
Regulators are paying attention. Mentions of “stablecoin” in US SEC filings rose to 2,298 in 2025 from 586 in 2024. In early 2026, 44% of market participants named regulation and compliance as the main bottleneck for scaling tokenized assets.
9. Tokenized real-world assets
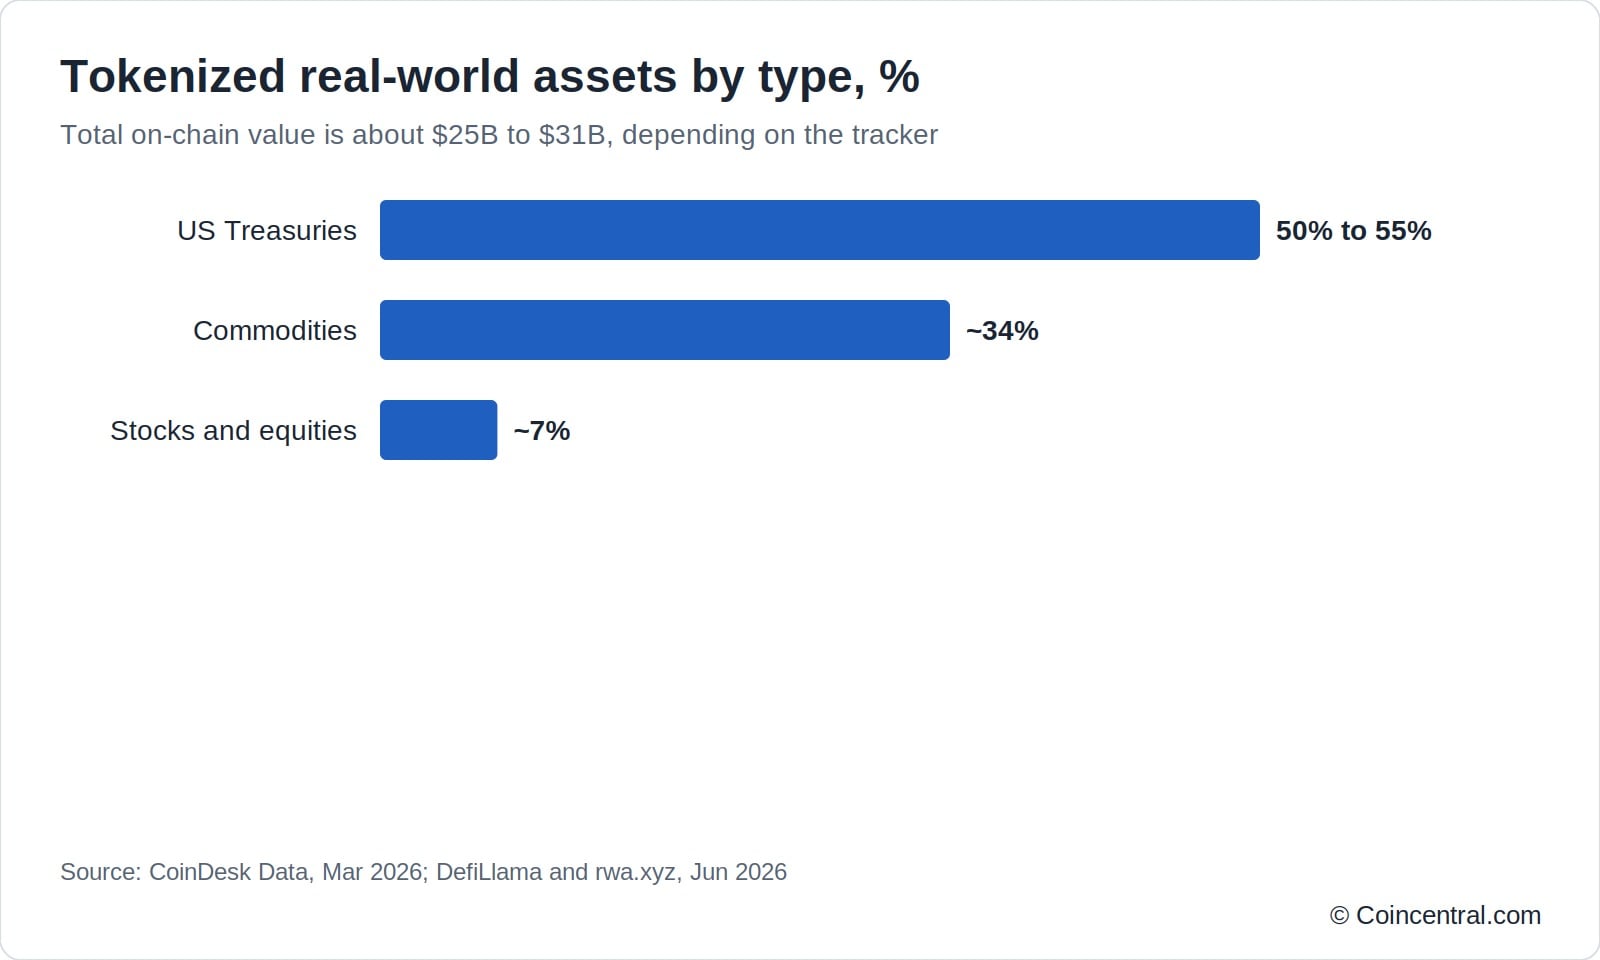
Stablecoins sit beside a growing set of tokenized real-world assets. Total on-chain value was about $25 billion by DefiLlama’s count and $29 billion to $31 billion by rwa.xyz in mid-2026. The difference comes from what each tracker includes.
Roughly 50% to 55% of tokenized assets are US Treasuries. Commodities make up about 34% and stocks about 7%, according to CoinDesk Data. Holders reached about 949,000, up about 13% in 30 days (rwa.xyz).
Tokenized Treasuries grew to about $12 billion to $15 billion in 2026, from $8.9 billion at the start of the year. Circle USYC and BlackRock BUIDL are the two largest funds, each at about $2.4 billion to $3.0 billion. USYC passed BUIDL for the top spot in early 2026.
Tokenized gold reached about $3.2 billion for Tether Gold (XAUt) and $2.3 billion for Paxos Gold (PAXG). Tokenized equities are small at about $1.1 billion, up about 46% in March 2026, led by xStocks.
Deutsche Bank Research describes three forms of digital money that are emerging side by side.
| Type | Who issues it | What you hold |
|---|---|---|
| Stablecoin | Private issuer | A token backed about 1:1 by reserves, transferable on public chains |
| Tokenised deposit | Commercial bank, such as JPMorgan | A claim on the bank, redeemable at par for central bank money |
| CBDC | Central bank, such as China’s e-CNY | Digital central bank money |
10. The outlook: forecasts to 2035
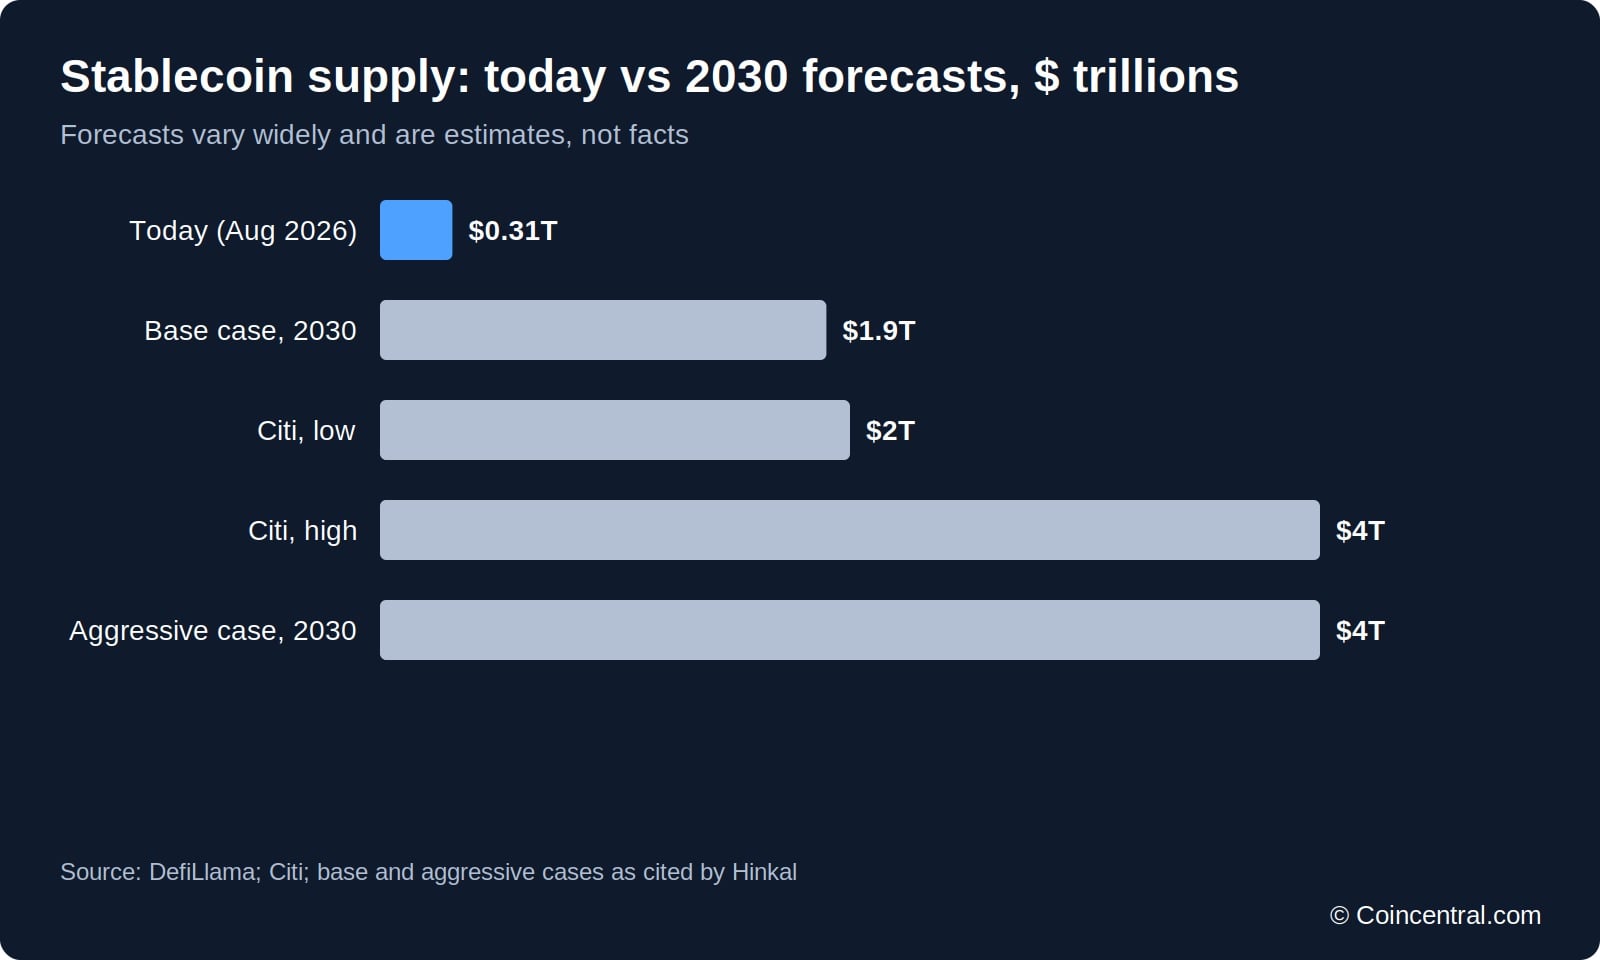
Forecasts point to steady growth, but they vary widely. Financial institutions expect stablecoins to handle 5% to 10% of global payments by 2030. That equals about $2.1 trillion to $4.2 trillion a year.
Citi projects the total stablecoin market at $2 trillion to $4 trillion by 2030. Hinkal cites a base case of $1.9 trillion and an aggressive case of $4 trillion. Today’s market is $308 billion.
| Forecast | Figure | Source |
|---|---|---|
| Cross-border B2B payments, 2035 | $5 trillion, from ~$13.4 billion in 2026 | Projection cited in the source material |
| Share of global payments, 2030 | 5% to 10% ($2.1T to $4.2T) | Financial institutions; EY |
| Total stablecoin market, 2030 | $2 trillion to $4 trillion | Citi |
| Cross-border market, non-G20 | $17.9 trillion addressable | FXC Intelligence |
| Cross-border market, non-G10 | $23.5 trillion upside | FXC Intelligence |
About 85% of future stablecoin value is expected to come from business-to-business use. Today’s B2B base is about $226 billion a year, according to McKinsey. Stablecoins still make up less than 1% of global cross-border payments.
Established firms are building their own rails. Visa, Mastercard, Stripe and Coinbase are backing a new stablecoin platform. Japan’s three megabanks plan a joint yen stablecoin by 2027.
Speed is one draw. FXC Intelligence says stablecoins can settle up to 500 times faster than traditional systems on some routes. Privacy is a concern, since every transfer on a public blockchain shows the sender, recipient and amount.
What the numbers show
The data shows a market that is large, concentrated and still growing. Supply is above $300 billion, and two issuers hold most of it. The dollar is almost the only currency in use.
It also shows a gap between volume and use. Trillions of dollars move on chains, but real payments are a few hundred billion. Regulation, reserves and business adoption will decide how fast that gap closes.
Readers should treat forecasts with care. Sources use different definitions, dates and methods, so the same topic can show several figures. Checking how each number was built is the best way to use this data.
Sources
- DefiLlama, Stablecoins dashboard (supply, chains, flows)
- Bank for International Settlements (BIS), stablecoin research
- International Monetary Fund (IMF), Stablecoins and the Future of Payments: Evidence from Financial Markets
- Artemis Analytics, stablecoin transaction data
- Bloomberg, reporting on Artemis stablecoin volume
- Boston Consulting Group (BCG) and Allium, stablecoin payments analysis
- McKinsey & Company, stablecoin payments research
- CoinDesk Data, Global Digital Asset Adoption Index and tokenized asset data
- rwa.xyz, tokenized real-world asset data
- Tether, transparency and attestation reports (BDO)
- Circle, USDC transparency and reserve reports
- Gemini, GUSD attestation reports
- World Bank, Remittance Prices Worldwide
- EY-Parthenon, 2025 stablecoin adoption survey
- European Central Bank (ECB), euro stablecoin research
- Visa, stablecoin settlement updates
- Statista, Stablecoin statistics and facts
- Hinkal, 15 Cross-Border Stablecoin Statistics 2026 (April 2026)
- FXC Intelligence, cross-border payments market data
- Deutsche Bank Research, digital money research
- CoinGecko, Bitcoin market capitalisation
- Citi, stablecoin market forecast


