





TLDR
- Bitcoin fell 3.6% in 24 hours to $80,764, while ether dropped 6.5% to $2,353.
- U.S. September CPI rose 3.7%, above the 3.6% forecast.
- Odds of a Fed rate hike on Oct. 28 rose to 53.7% from 22.1%.
- South Korea’s Kospi fell 8% and Japan’s Nikkei 225 fell 5.2%.
- Crypto liquidations reached $951.4 million in 24 hours.
Bitcoin (BTC) fell below $81,000 during Asian trading hours on Thursday. The price dropped 3.6% over 24 hours to $80,764.
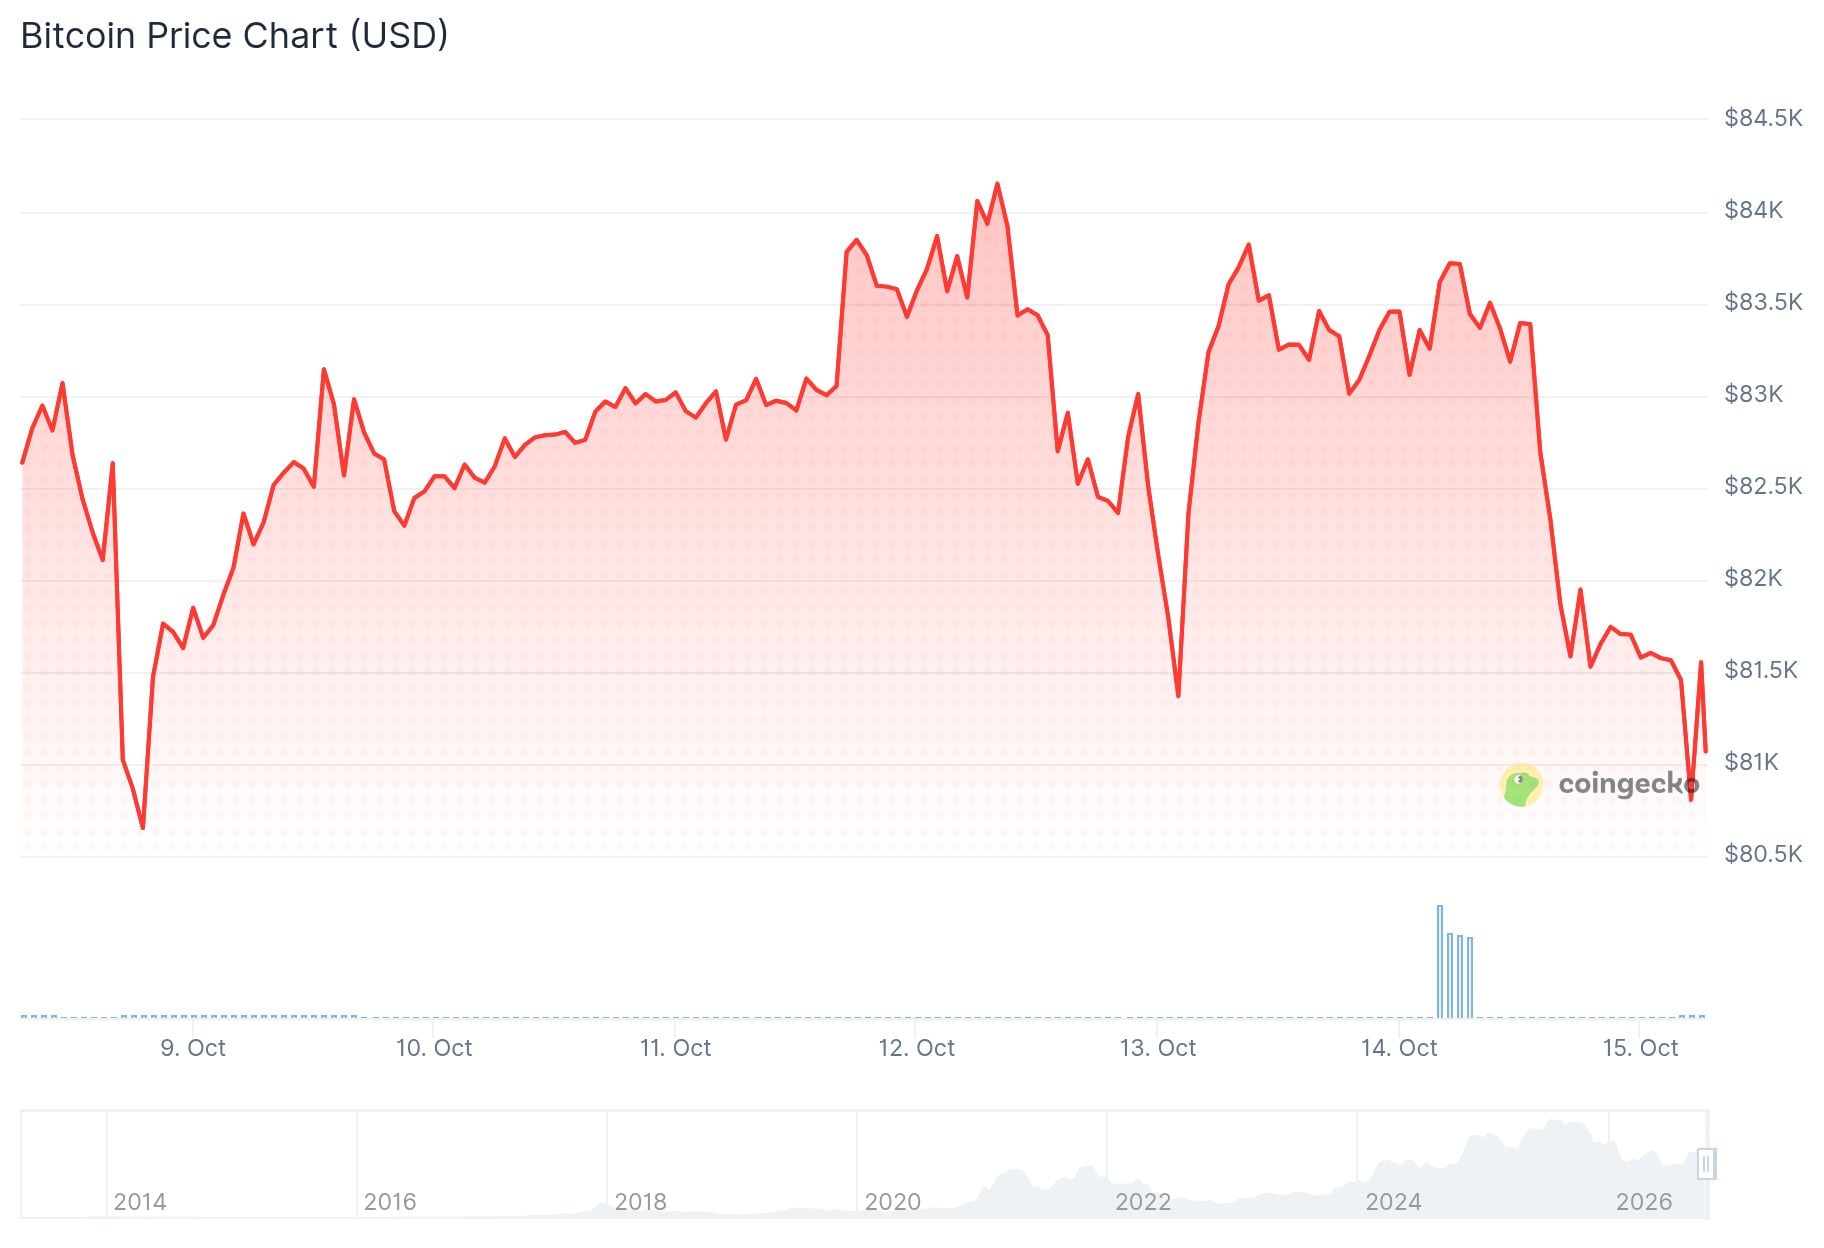
Ether (ETH) lost 6.5% to $2,353 over the same period. Zcash had the biggest loss among the top 10 cryptocurrencies, down 12.8% at $1,101.
The decline followed Wednesday’s U.S. inflation report. September CPI rose 3.7% year over year, above the 3.6% forecast.
BREAKING: September CPI inflation rises to 3.7%, above expectations of 3.6%
Core CPI inflation rises to 2.6%, also above expectations of 2.5%.
This officially marks the third highest US inflation reading since September 2023.
Rate hike expectations are rising on the news.
— The Kobeissi Letter (@KobeissiLetter) October 14, 2026
Bitcoin slipped to $81,926 on Bitstamp after the release. Gold fell to $4,079 per ounce.
Inflation Data Shifts Fed Expectations
Gasoline prices rose 9.1% in September and made up over half of the monthly increase, the Bureau of Labor Statistics said. Core CPI came in at 2.6%, also 0.1% above forecasts.
CME Group’s FedWatch Tool now shows a 53.7% chance of a 25-basis-point rate hike at the Fed’s Oct. 28 meeting. That is up from 22.1% a day earlier.

The odds of a second hike in December stand at 50%. Econoday analyst Theresa Sheehan said the Fed is probably on hold in October, with “a definite bias toward a hike in December.”
The 10-year U.S. Treasury yield hit 5.329%, about three basis points from a 24-year high. Economist Robin Brooks wrote that the data was “the last thing global bond markets needed.”
Asian Stocks and Key Bitcoin Levels
Asian equities also fell on Thursday. South Korea’s Kospi dropped 8%, while Japan’s Nikkei 225 declined 5.2%. Samsung Electronics and SK Hynix each lost more than 9%.
Dominick John of Zeus Research told The Block the moves reflected a broader risk-off mood. He said weakness in U.S. tech stocks spilled into both markets.
Analyst Daan Crypto Trades pointed to the $72,000 to $75,000 range as an area where several support levels overlap. These include the Bull Market Support Band, the 2024 summer range high, key Fibonacci levels and the daily 200 moving average.
$BTC The amount of confluence sitting between $72K-$75K is pretty crazy.
– Bull Market Support Band
– 2024 Summer range high/Big horizontal region
– 0.5 & 0.618 Fib levels from the impulse up
– Daily 200MA/EMA (EMA has always been tested in prior breakouts from the bear market)… pic.twitter.com/nxqDXQ46qu— Daan Crypto Trades (@DaanCrypto) October 14, 2026
He said no one knows if Bitcoin will test that zone, but having a plan helps. He added that a break above $87,000 could lead to a squeeze toward the high $90,000s.
On the one-hour BTC/USD chart from TradingView, the price fell sharply after the CPI release. Bitcoin had been circling a zone between $82,500 and $83,400, which analysts were watching as possible support.
That zone now sits above the price. The level to watch next is the $82,500 to $83,400 area, which Bitcoin needs to reclaim to show buyers are back.
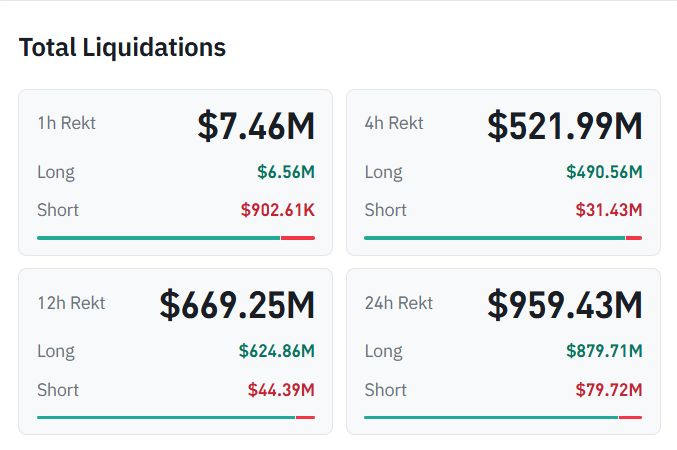
Crypto liquidations reached $951.4 million over 24 hours, including $876.3 million in long positions, CoinGlass data showed. Solana lost 4.8% and XRP slid 4.7%.
The next U.S. inflation report, the September Producer Price Index, is due Friday.


